Punnett square calculator
Enter parent genotypes to generate 2×2 or 4×4 Punnett squares with live genotype and phenotype probabilities. Print blank worksheets or download crisp SVGs and PNGs. Free, with no account.
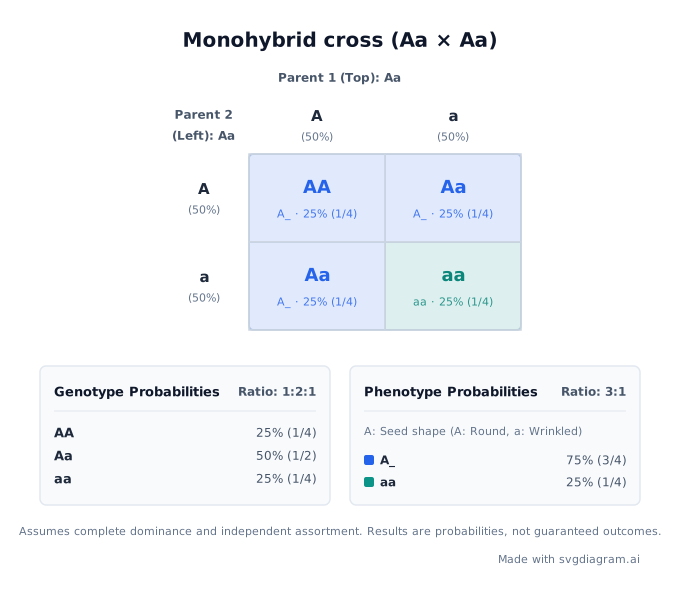
Blank Punnett square worksheets
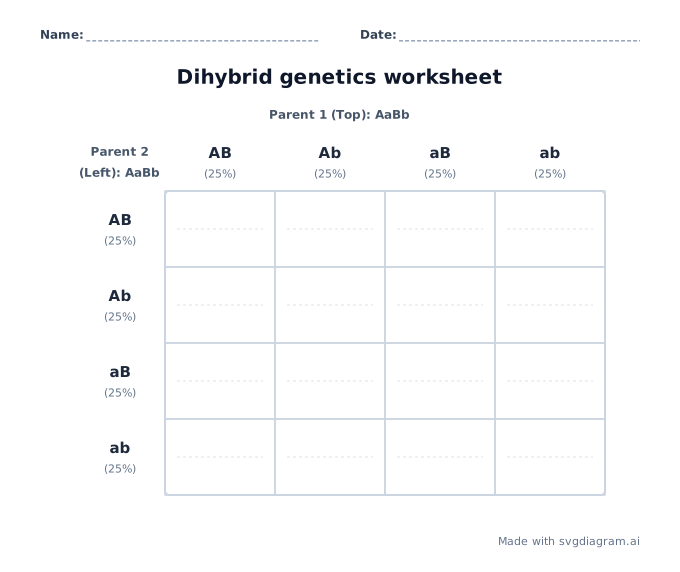
Print blank 2×2 or 4×4 Punnett squares for genetics homework and lab work. Printing saves directly to PDF.
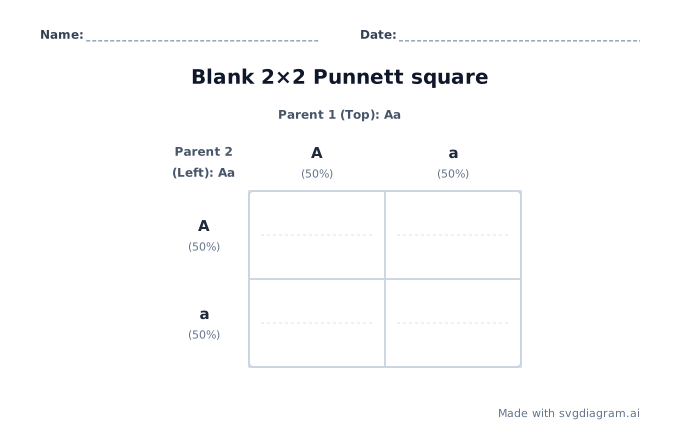
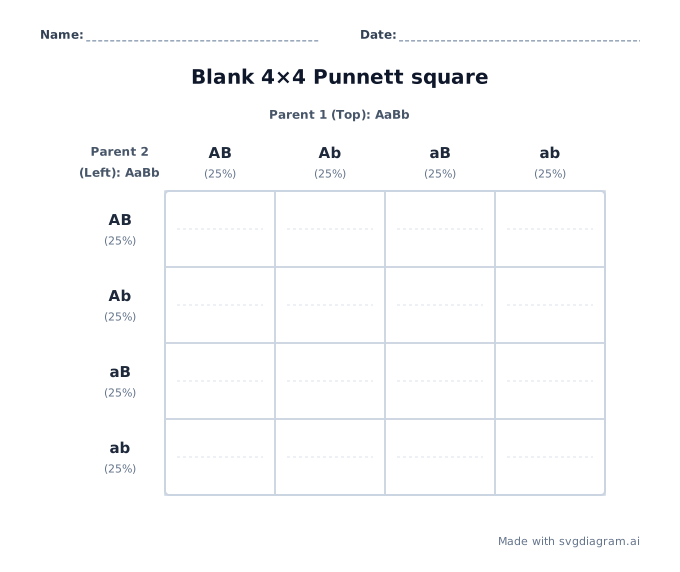
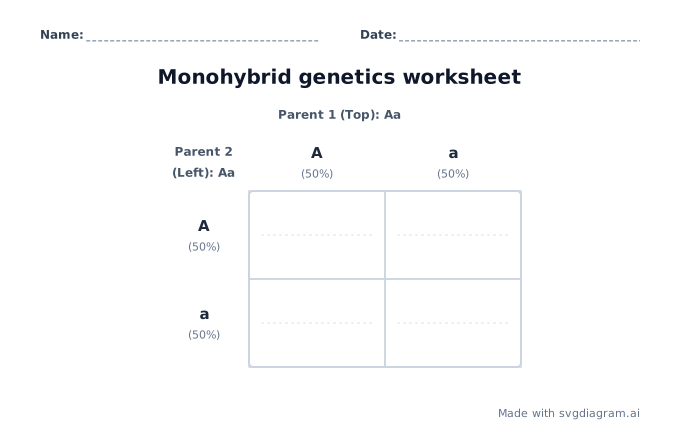
Punnett square worked examples
Open a Mendelian cross in the calculator to inspect gametes, probabilities, and phenotype ratios.
How to read and build a Punnett square
What a Punnett square shows
A Punnett square is a visual grid invented by geneticist Reginald Punnett to predict the possible genetic outcomes of a cross between two parent organisms. By writing each parent's allele contribution (gametes) along the top and left headers, every grid cell represents a potential genotype for their offspring.
This calculator calculates expected probabilities for monohybrid (1-gene, 2×2 grid) and dihybrid (2-gene, 4×4 grid) Mendelian crosses.
- Genotype: The specific allele combination inherited by the offspring (such as AA, Aa, or aa).
- Phenotype: The observable physical trait resulting from the genotype (such as Round vs. Wrinkled seeds).
- Expected Ratios: Punnett squares display mathematical probabilities for large sample sizes, not guaranteed counts for small litters or families.
Scientific principles and assumptions
This tool models classic Mendelian inheritance based on Gregor Mendel's foundational laws of genetics (OpenStax Biology 2e):
- Complete Dominance: The dominant allele (capital letter, e.g. A) completely masks the recessive allele (lowercase letter, e.g. a). Heterozygotes (Aa) display the dominant phenotype.
- Law of Segregation: Each parent contributes one allele per locus to every gamete with equal probability (50% chance for A or a from an Aa parent).
- Law of Independent Assortment: Alleles for separate genes sort into gametes independently (University of Arizona Dihybrid Cross). This applies to unlinked loci on different chromosomes.
Note on traits: Classroom examples use well-documented single-gene pea plant traits (Pisum sativum) such as seed shape (R/r), seed color (Y/y), flower color (P/p), or stem height (T/t). Polygenic human traits like eye color or skin tone involve complex multi-gene interactions and are not modeled here.
How to use the calculator
- Select cross type: Choose 1 Gene (Monohybrid) for a 2×2 grid or 2 Genes (Dihybrid) for a 4×4 grid.
- Enter parent genotypes: Type allele pairs for Parent 1 and Parent 2 (e.g.,
AaorAaBb). Capital letters represent dominant alleles and lowercase letters represent recessive alleles. - Add trait descriptions: Optionally enter trait names (such as
Seed shape (A: Round, a: Wrinkled)orSeed color (B: Yellow, b: Green)). - Customize appearance: Choose color palettes, tinted or outlined grid cells, fonts, and background options.
- Export or print: Download a vector SVG or high-resolution PNG for presentation slides and documents, or switch to Worksheet mode to print blank student handouts with Name and Date lines.
Monohybrid crosses (2×2 grid)
A monohybrid cross tracks the inheritance of a single gene locus with two alleles (A and a):
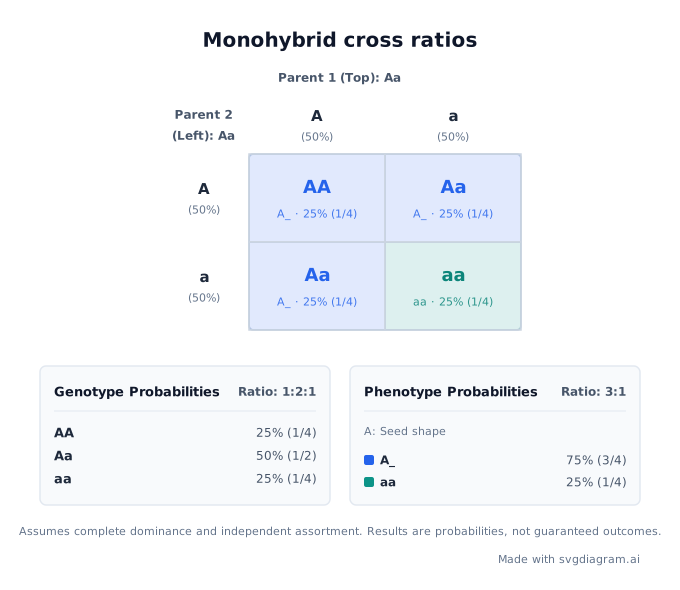
- Heterozygous Cross (Aa × Aa): Yields a 1:2:1 genotype ratio (25% AA, 50% Aa, 25% aa) and a classic 3:1 phenotype ratio (75% Dominant, 25% Recessive).
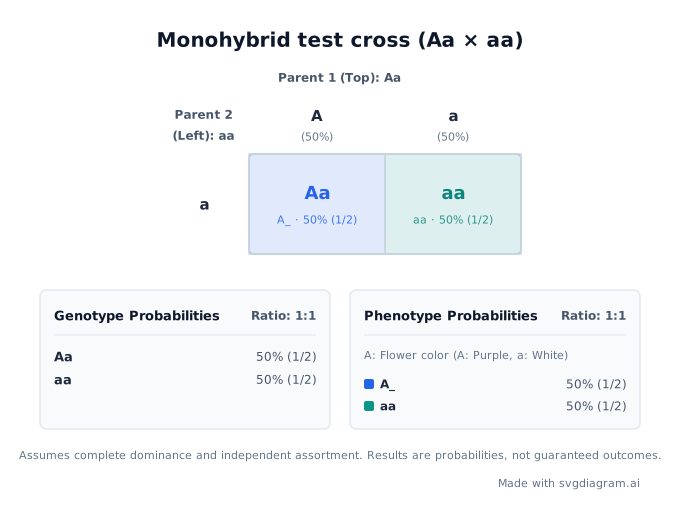
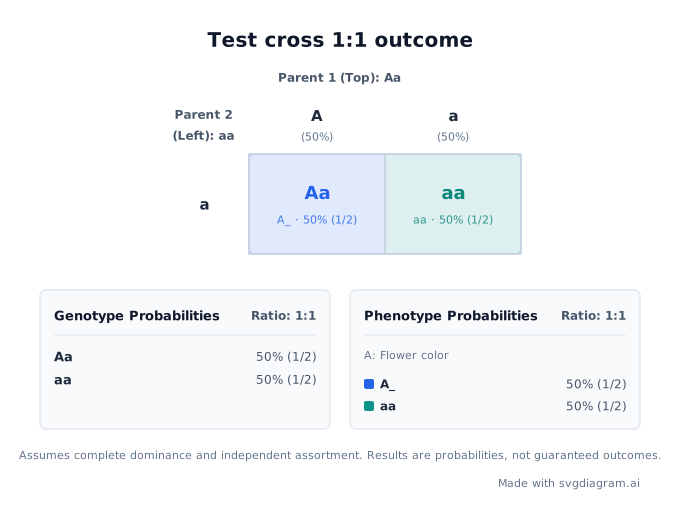
- Test Cross (Aa × aa): Crossing a dominant phenotype individual with a homozygous recessive parent produces a 1:1 phenotype ratio (50% Aa, 50% aa), revealing whether the dominant parent carries a hidden recessive allele.
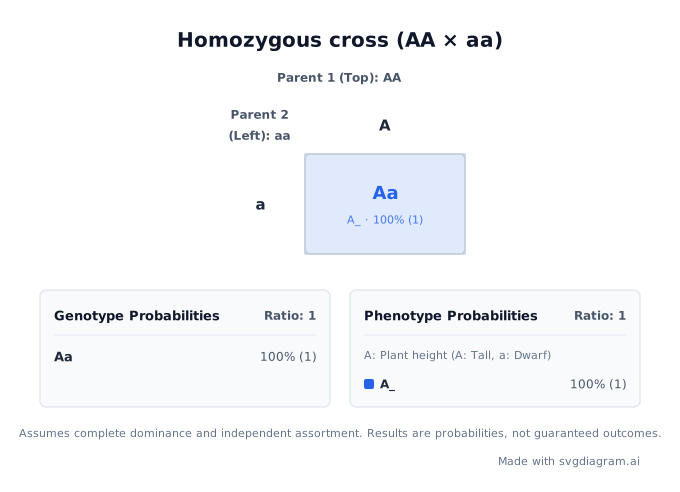
- Homozygous Cross (AA × aa): Results in 100% heterozygous (Aa) offspring exhibiting the dominant trait.
Dihybrid crosses (4×4 grid)
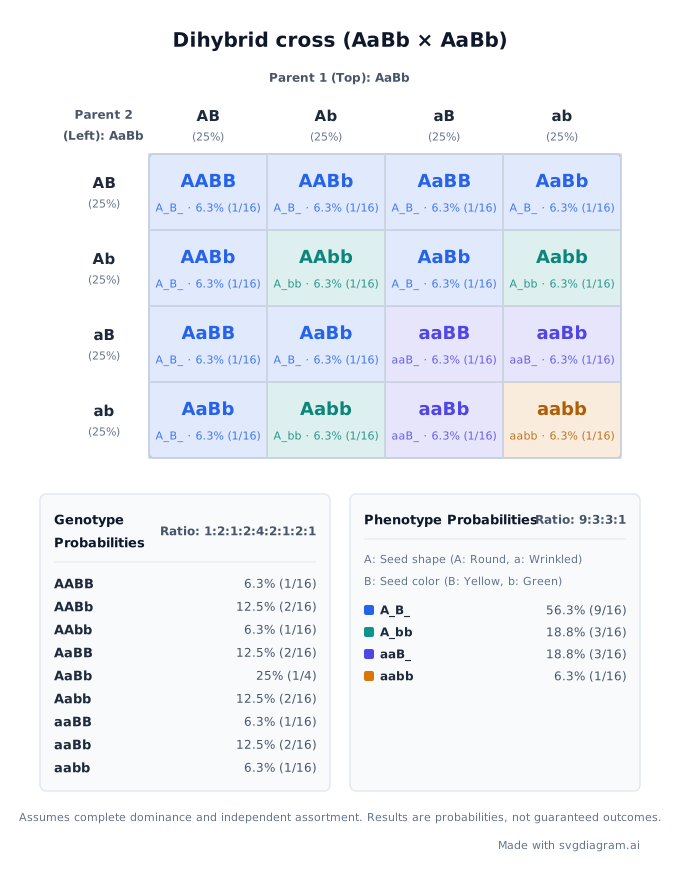
A dihybrid cross tracks two independent gene loci simultaneously (A/a and B/b). Each parent produces up to 4 unique gametes (AB, Ab, aB, ab), forming a 16-cell grid:
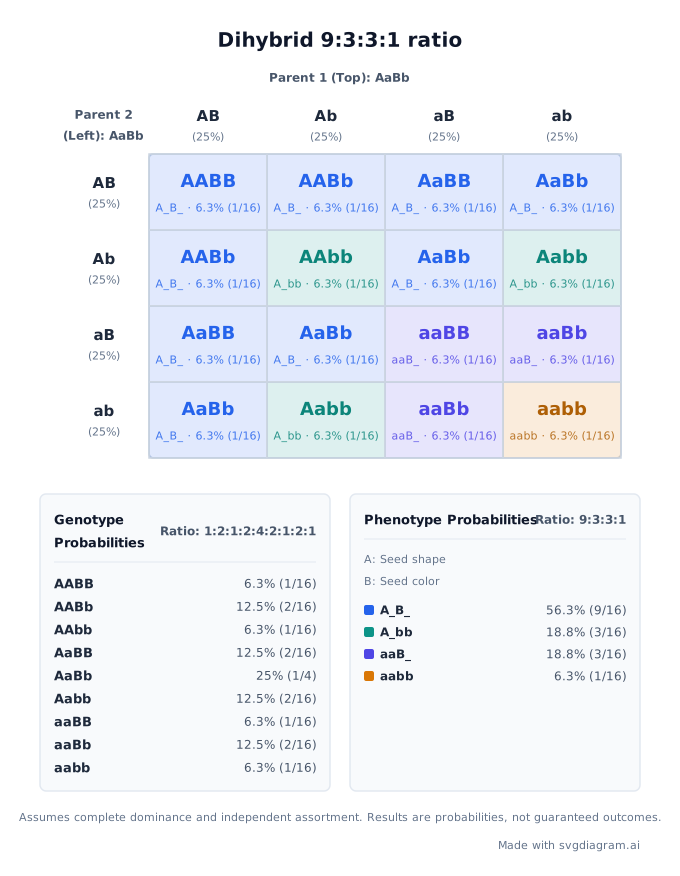
- Dihybrid Heterozygous Cross (AaBb × AaBb): Produces the classic Mendelian 9:3:3:1 phenotype ratio:
- 9/16: Both dominant traits (A_B_)
- 3/16: First dominant, second recessive (A_bb)
- 3/16: First recessive, second dominant (aaB_)
- 1/16: Both recessive traits (aabb)
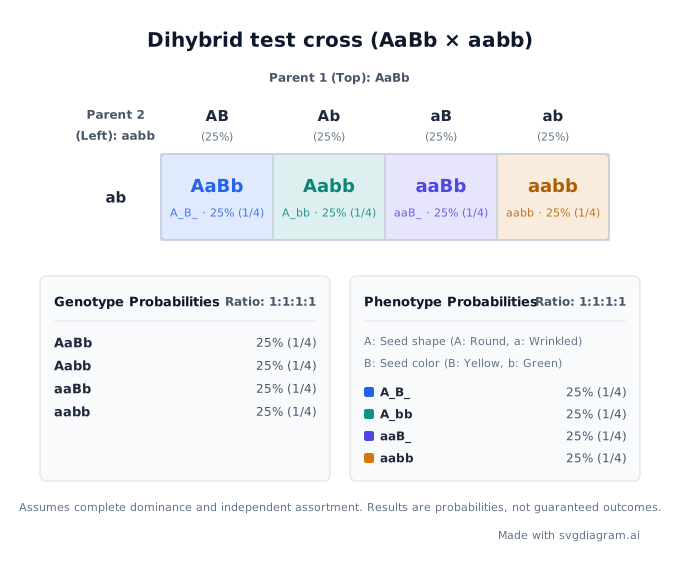
- Dihybrid Test Cross (AaBb × aabb): Produces an equal 1:1:1:1 ratio across all four phenotype combinations.
Printable blank templates and worksheets
Teachers and students can generate clean, printable Punnett square grids for homework, classroom quizzes, or lab work:
- Blank 2×2 & 4×4 grids: Clean outlined grid squares ready to fill by hand.
- Genetics Worksheets: Includes Name and Date lines with light writing guides inside every cell.
- Print or save to PDF: Click Print in the maker or gallery to send directly to your printer or save as a PDF.
Put a Punnett square in Google Docs or PowerPoint
- Generate your diagram in the maker.
- Click Copy image to copy the PNG to your clipboard.
- Paste directly into Google Docs, Google Slides, PowerPoint, Word, or Notion.
- For maximum sharpness in print or vector presentations, download the SVG and insert it as a scalable vector graphic.
Explore other diagram types
Templates for each type, filled in from a description of your content.