Venn diagram maker
Type what belongs to each set, and the circles size themselves around your lists. Download it as SVG or PNG, copy it, or print it. Free, with no account.
Have lists or a spreadsheet? and the overlaps are found for you, or drop a file anywhere on the maker.
Blank Venn diagram templates
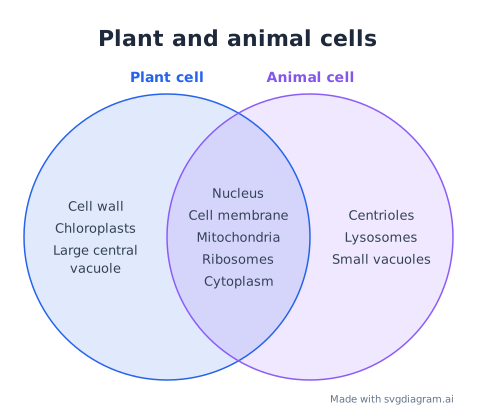
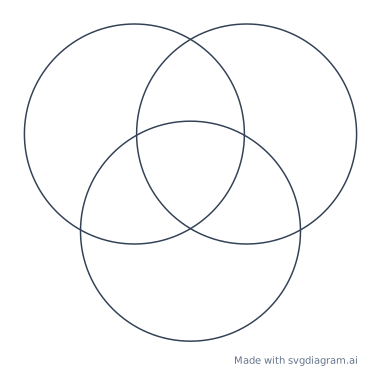
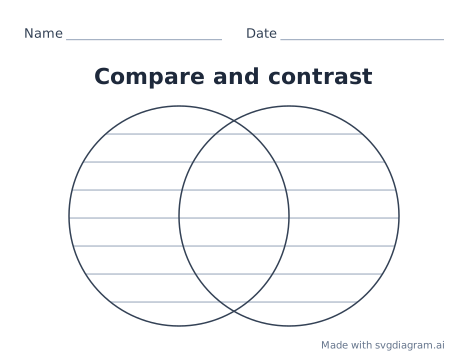
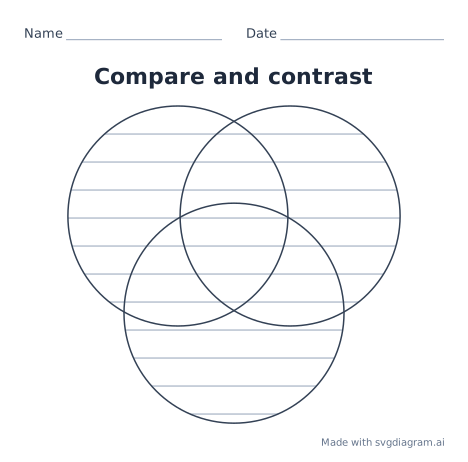
Print a blank 2- or 3-circle Venn diagram to fill in by hand, or open one and type in it. Printing also saves a PDF.
Venn diagram examples
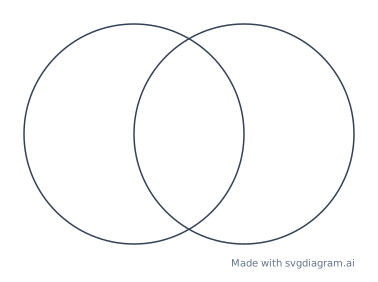
Open one in the maker and change it to fit your topic.

How to read a Venn diagram
What a Venn diagram shows
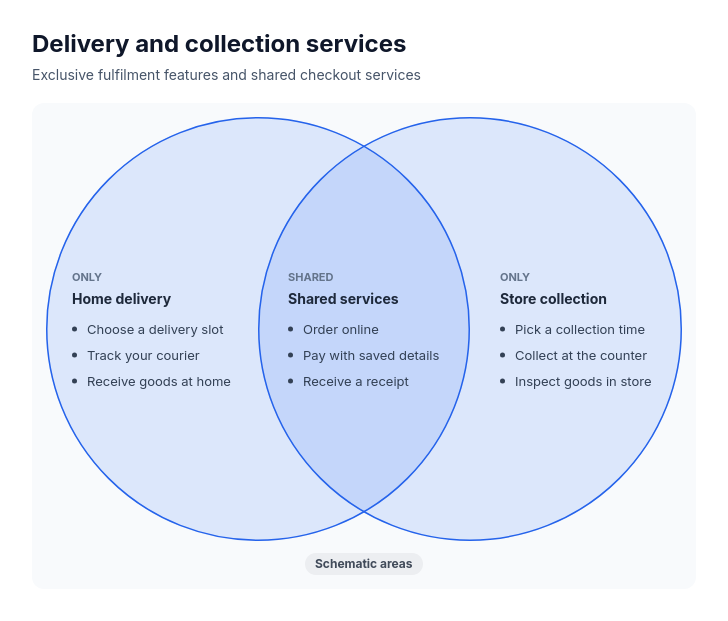
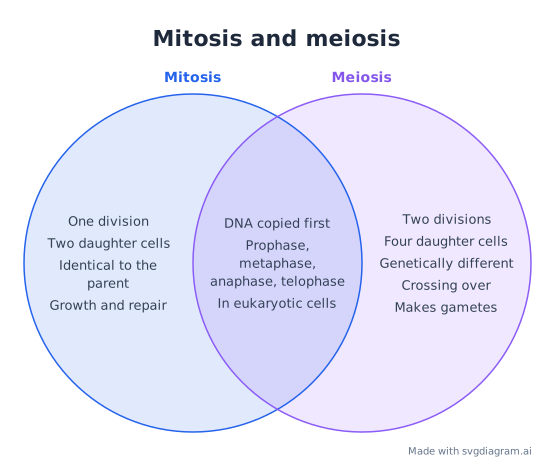
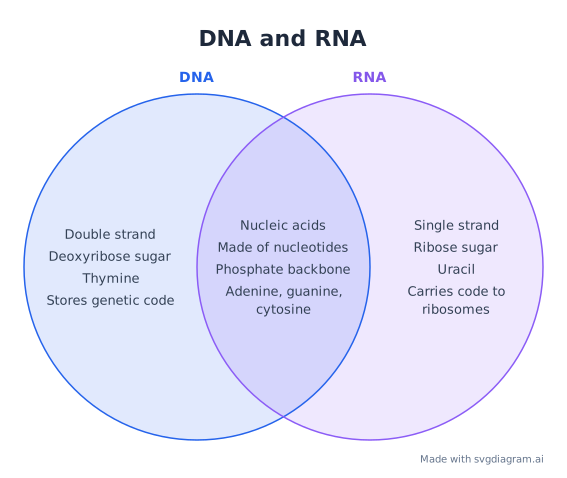
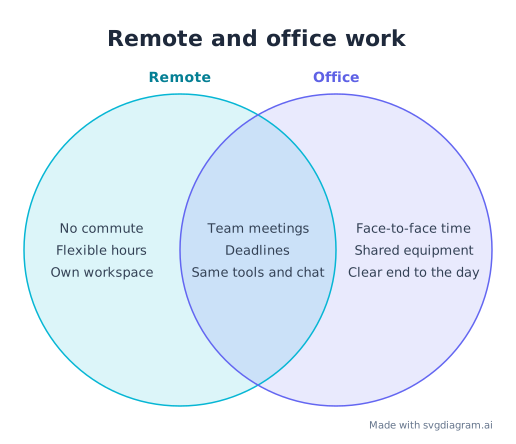
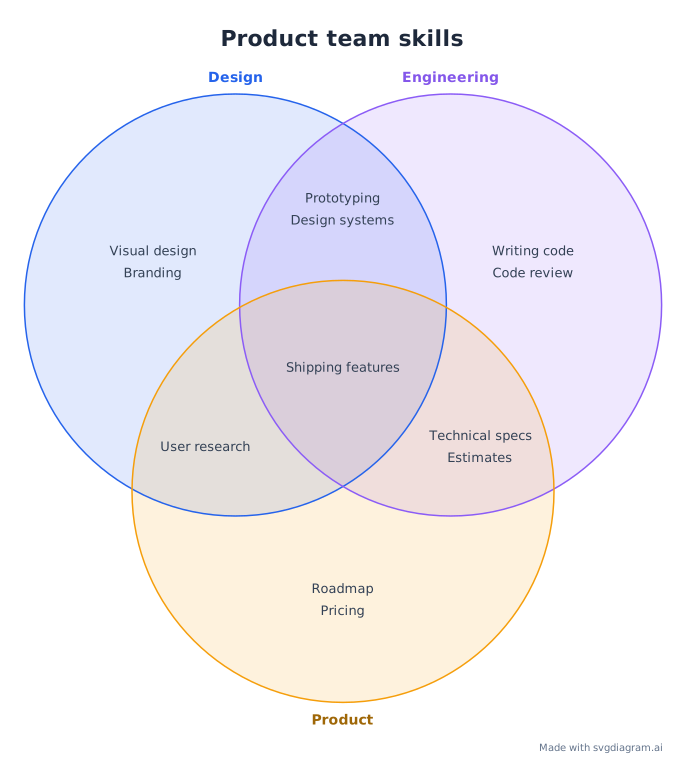
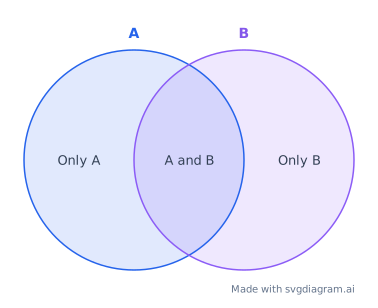
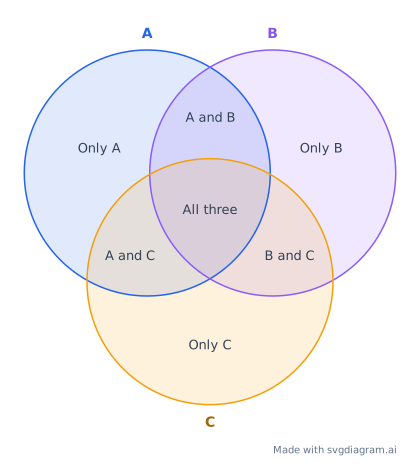
A Venn diagram compares groups by drawing each one as a circle. Where circles overlap, the items belong to both groups; the parts that do not overlap hold what is unique to one group. With two circles you get three regions: only the first, only the second, and both. With three circles you get seven: three unique regions, three pairs, and the center that all three share.
The circles here are equal in size and do not encode amounts. They show which items belong where, not how many there are. To show a count, type the number into its region.
When to use one
- Comparing two or three things in class: plant and animal cells, mitosis and meiosis, two characters in a book.
- Solving set and probability problems in math, with numbers in each region and the universal set around them.
- Weighing options: what two products, plans, or tools have in common and where they differ.
- Finding common ground: skills shared by roles, topics shared by teams, features shared by competitors.
How to make a Venn diagram
- Choose two or three circles and name each set.
- Type the items for each region, one per line. Leave a region empty if nothing belongs there.
- Pick a color set or your own colors, tinted or outline circles, a text size, and a font.
- Download an SVG for slides, documents, and web pages, where it stays sharp at any size, or a PNG. Copy image puts it on your clipboard, and Print makes a handout or a PDF.
The address in your browser updates as you type, so you can bookmark the diagram or share it with Copy link and pick up where you left off.
Compare two or three lists
Switch Items to Compare lists to let the maker work out the regions. Paste each set's list, one item per line or separated by commas, or drop a CSV or TXT file, or copy columns from Excel or Google Sheets and paste them in: each column becomes a set, and its first row can name it. The maker finds what appears in only one list and what the lists share, ignoring repeated spaces and, if you choose, upper and lower case. Each set's size and each region's count show beside the lists.
Show items to draw the items themselves, or counts for long lists, such as two customer lists or two sets of keywords. Switching back to Type regions keeps the regions the comparison found, so you can tidy them by hand.
Three circle Venn diagrams
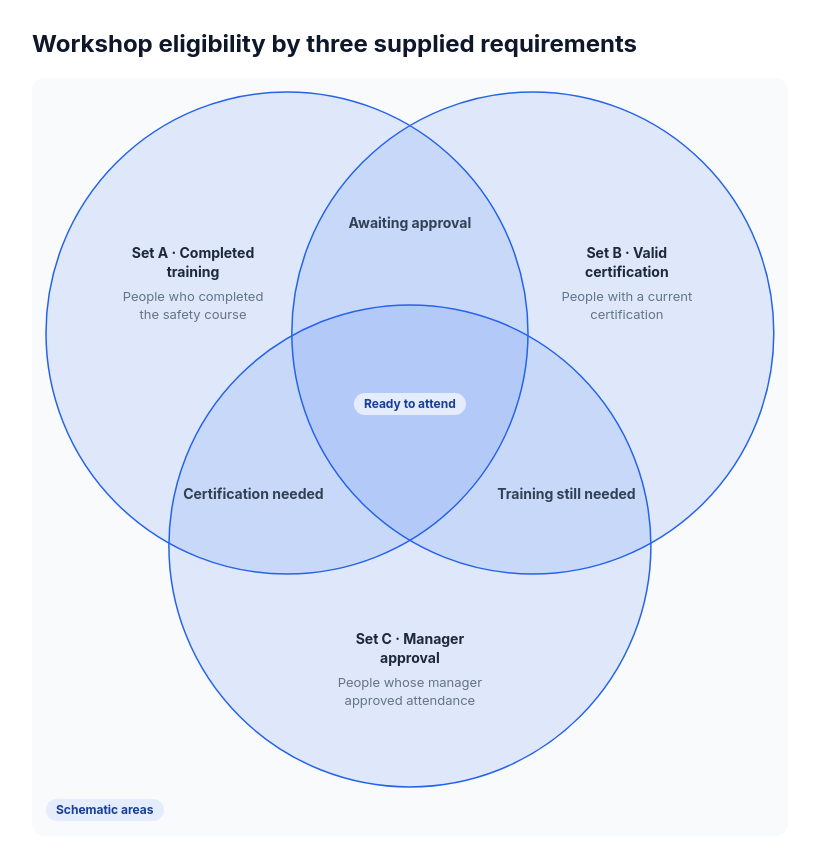
A triple Venn diagram compares three groups at once. Each pair of circles overlaps in a region that belongs to those two sets only, and the center holds what all three share. Fill the center first: if it stays empty, the three groups may have less in common than the topic suggests. Three circles need shorter items than two, since the pair regions are narrow.
Venn diagrams in math
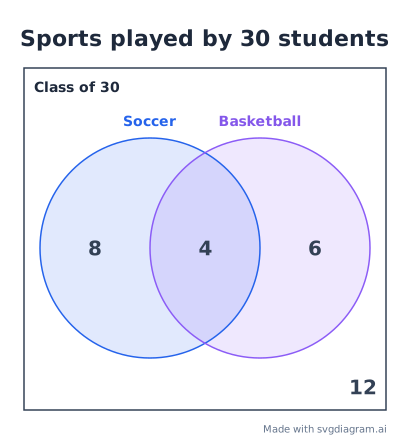
In math, a Venn diagram usually sits inside a rectangle for the universal set, often labeled U, and anything that belongs to no set goes in the rectangle outside the circles. Turn on the universal set box to get both. Type numbers instead of words to show how many items fall in each region, for counting and probability problems: in a class of 30, if 8 play only soccer, 6 only basketball, and 4 both, then 12 play neither.
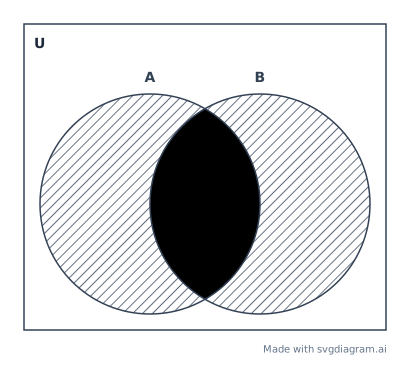
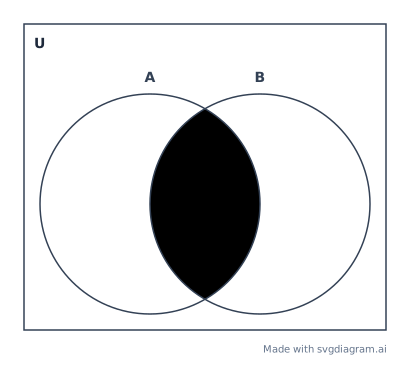
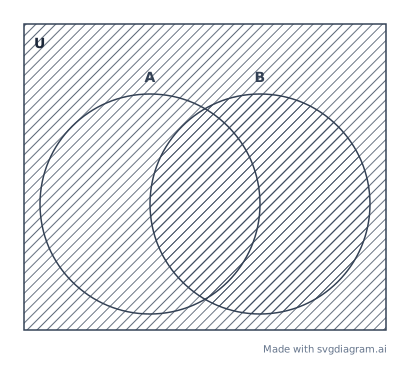
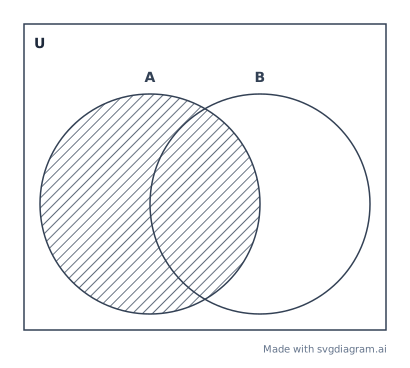
Shading marks the regions a statement describes:
- A or B (the union) shades both circles completely.
- A and B (the intersection) shades only the overlap.
- Not A (the complement) shades everything outside circle A, including the region outside every circle.
- A but not B shades only the part of A outside B.
Use Shade next to each region to build any of these, and outline circles so the hatching stays easy to read.
Blank templates and worksheets
A blank template is two or three empty circles to fill in by hand. Teachers hand them out for compare-and-contrast work, and students use them to plan an essay or study for a test. The worksheet versions add Name and Date lines and ruled lines inside the circles to write on. Print one from the templates above, or open it here, type the set names, and print it with only the names filled in.
Put a Venn diagram in Google Docs or PowerPoint
- Make the diagram here.
- Select Copy image.
- Paste it into Google Docs, Google Slides, PowerPoint, Word, or Notion.
For a sharper result in PowerPoint and Word, download the SVG and insert it as a picture: it stays crisp at any size. Google Docs and Slides take the PNG.
Tips for a clear diagram
- Keep items short: a word or a short phrase reads better than a sentence.
- Put each item in exactly one region. If it fits two sets, it belongs in their overlap.
- Use clearly different colors, so readers can tell the circles apart where they overlap.
- Choose large text for a slide or a printout read from across a room.
Explore other diagram types
Templates for each type, filled in from a description of your content.
Build it with AI
Describe your content and AI builds the diagram on the design you choose. Edit it after as much as you like.