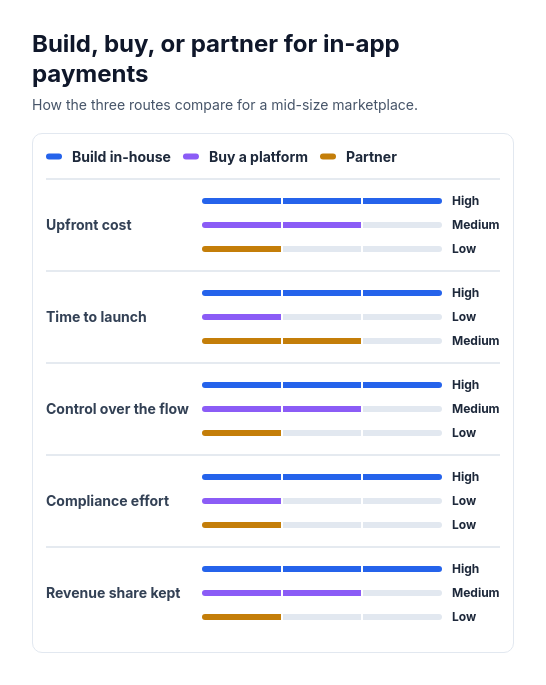
Diagram template
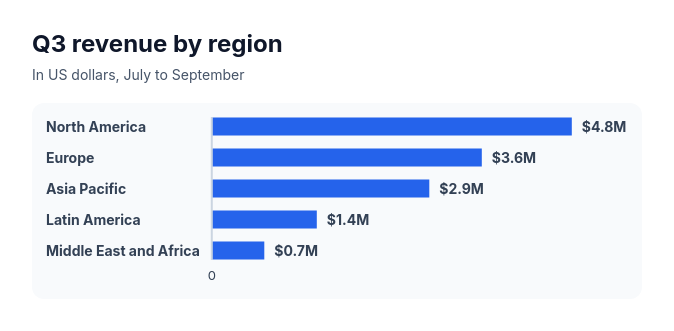
Bar chart
Three to ten horizontal bars growing from one quiet baseline, with their labels in a left column and each value, with an optional currency sign and unit, just past the end of its bar.
Categories
Included in
Free, Pro, Power, Max
When to use it
Use to compare three to ten amounts of the same kind, such as sales by region, survey answers, or time per task. Not for amounts on different scales, negative values, shares of one whole shown as parts, trends over time, or requests that give no numbers.
Adjust after generating
Change the style, colors, and font, and these options, as often as you like without spending credits.
- Color distribution
- Typography
- Spacing
What you fill in
Describe your topic in plain words and the AI fills these in. You can edit every field afterwards.
- Prefix
- Text
- Suffix
- Text
- Bars
- 3 to 10, each with label and value