Diagram template
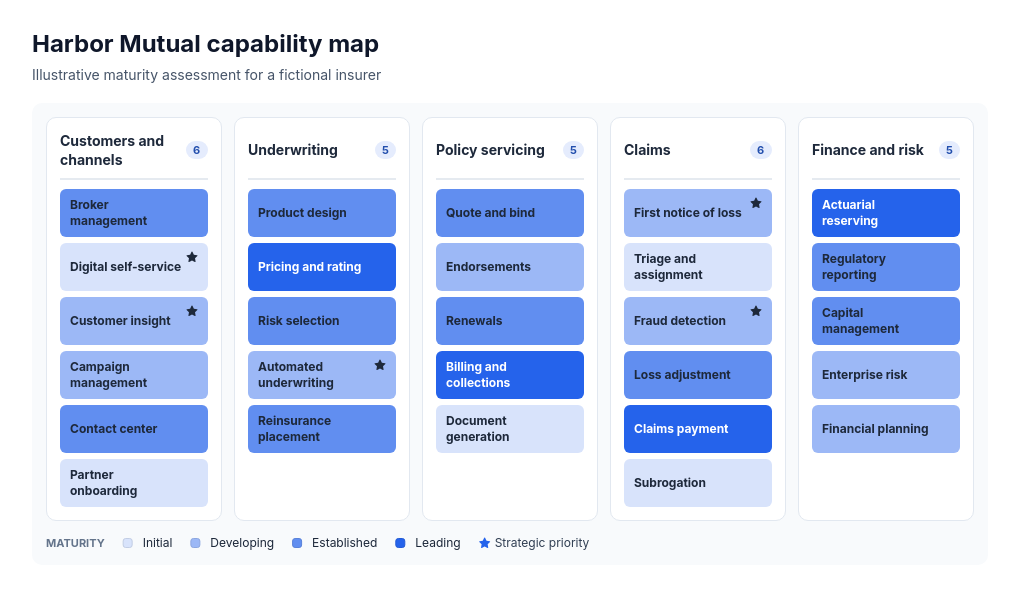
Capability map
PowerThree to six ordered domain panels side by side, each headed by its name and capability count, holding uniform capability tiles on one pitch, every tile shaded by its supplied grade on an ordered three- or four-step scale, with an optional flag marker and a grade key.
Categories
Included in
Power, Max
When to use it
Suits an enterprise or business capability map graded by maturity, an investment heat map (divest, maintain, invest), a function-by-function readiness or risk rating, or a service catalog marked by coverage: what the organization does, grouped by domain, and how each capability rates. Grades are supplied classifications, not scores; tile position and panel size do not rank capabilities. Not for processes, dependencies between capabilities, or numeric measures.
Adjust after generating
Change the style, colors, and font, and these options, as often as you like without spending credits.
- Card shape
- Card border
- Card shadow
- Typography
- Spacing
What you fill in
Describe your topic in plain words and the AI fills these in. You can edit every field afterwards.
- Level label
- Text
- Level names
- 3 to 4
- Groups
- 3 to 6, each with name
- Entries
- 8 to 36, each with name, group, level, and optional flagged
- Flag label
- Text
Related templates
All framework templates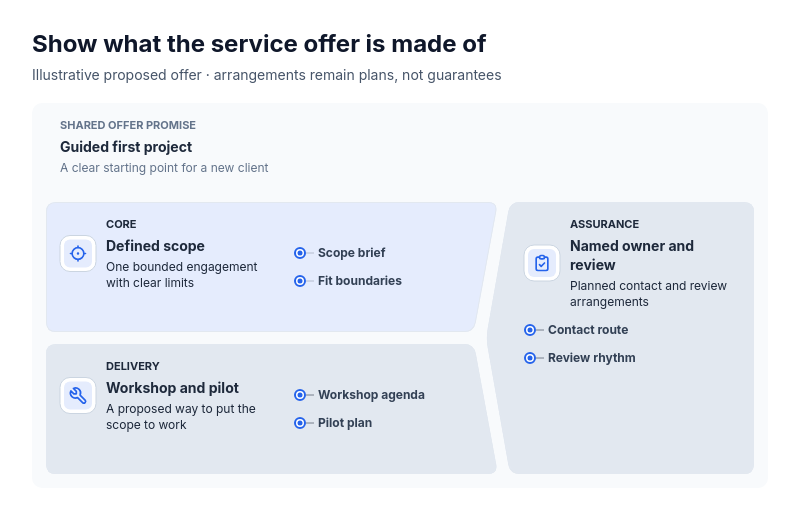 Anatomy: crowned subjectFor explaining what one thing is made of as a primary part, the part that carries it out and a part that spans both: a service offer (scope, delivery, assurance), a product (core function, how it ships, support), a course (content, format, learner support), an event (program, logistics, hosting) or a team charter (mission, ways of working, backing).
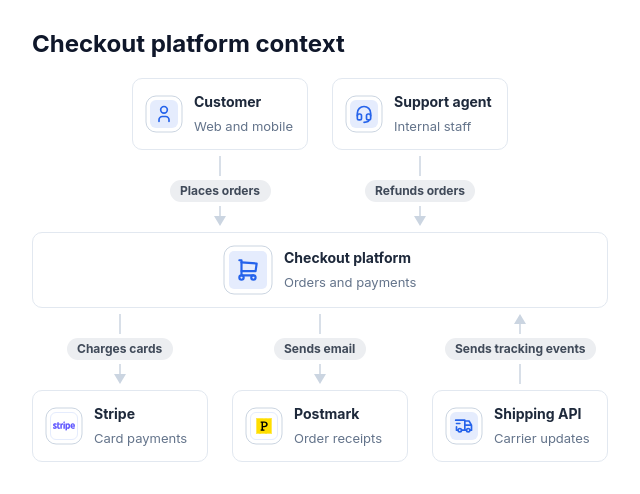 Architecture: system contextA C4 system context diagram, a "who uses it and what it depends on" slide, or an integration overview: one system, one to four actors that use it, and one to five external systems it calls or that call it, each link saying what it does.
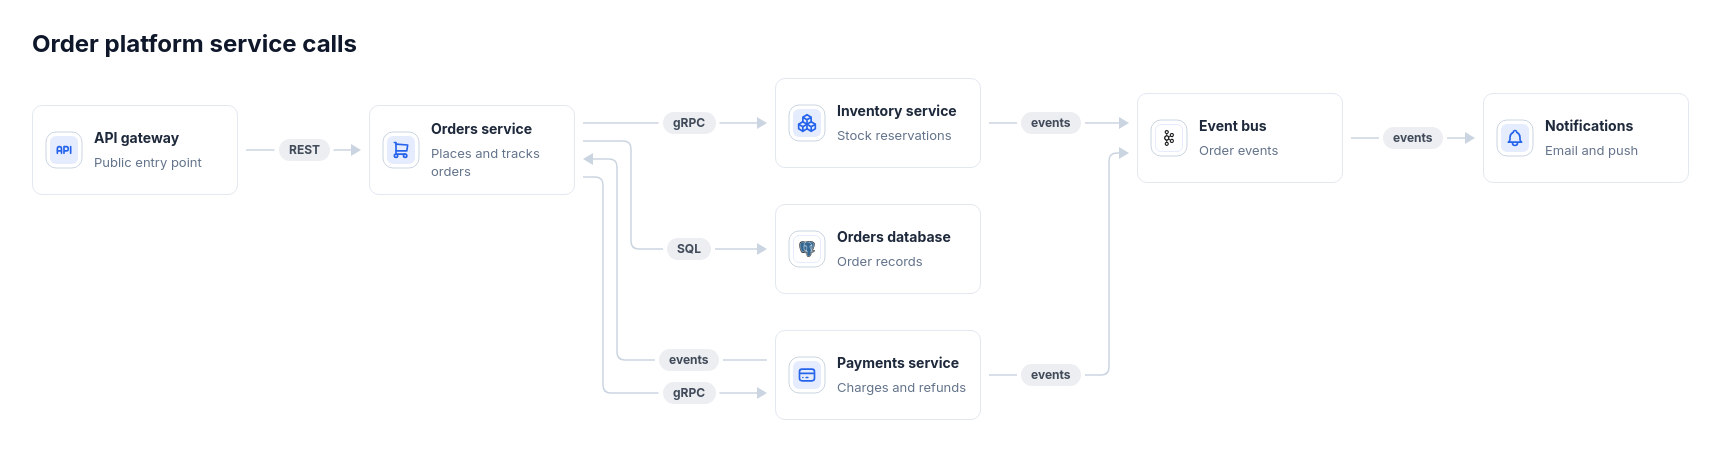 Architecture: dependency graphThree to twelve components that call or depend on each other with no fixed tiers, such as a microservice call map, a service dependency graph, or data lineage between systems, with links labeled by protocol or what flows (gRPC, REST, events).
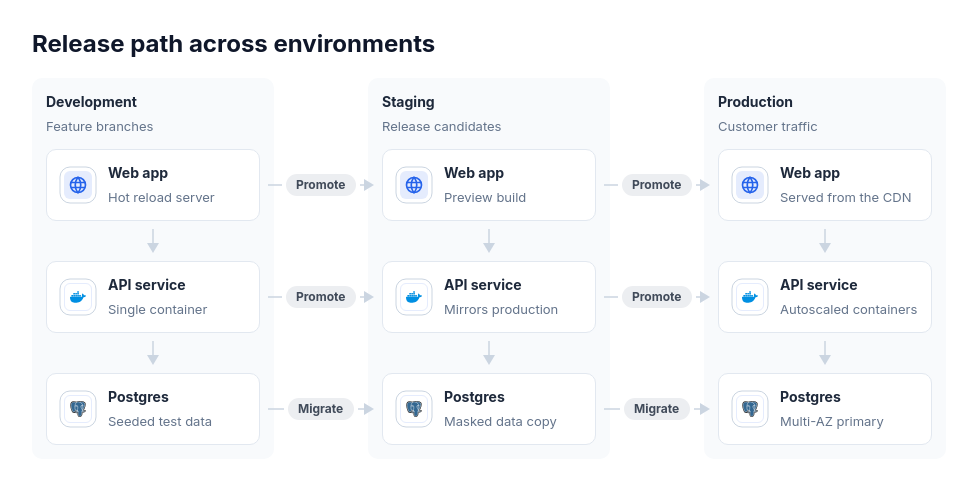 Architecture: environmentsOne system shown as two to four copies that are compared side by side: dev, staging, and production environments with promotion between them, region A, region B, and disaster recovery with replication, or blue and green stacks.
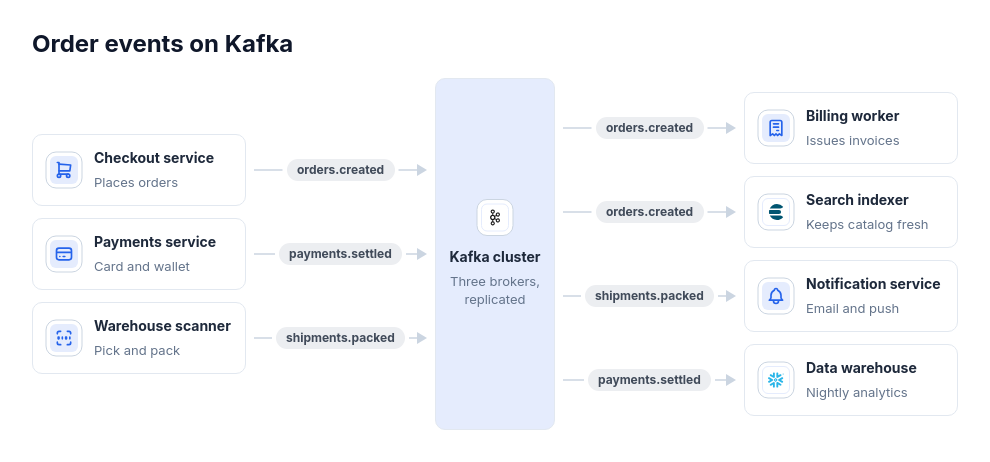 Architecture: event hubEvent flows through one broker, bus, or topic hub with one to five producers and one to five consumers, such as Kafka topics, Google Pub/Sub, SNS fanning out to SQS queues, EventBridge rules, or a webhook gateway delivering to several handlers; built for fan-in and fan-out.
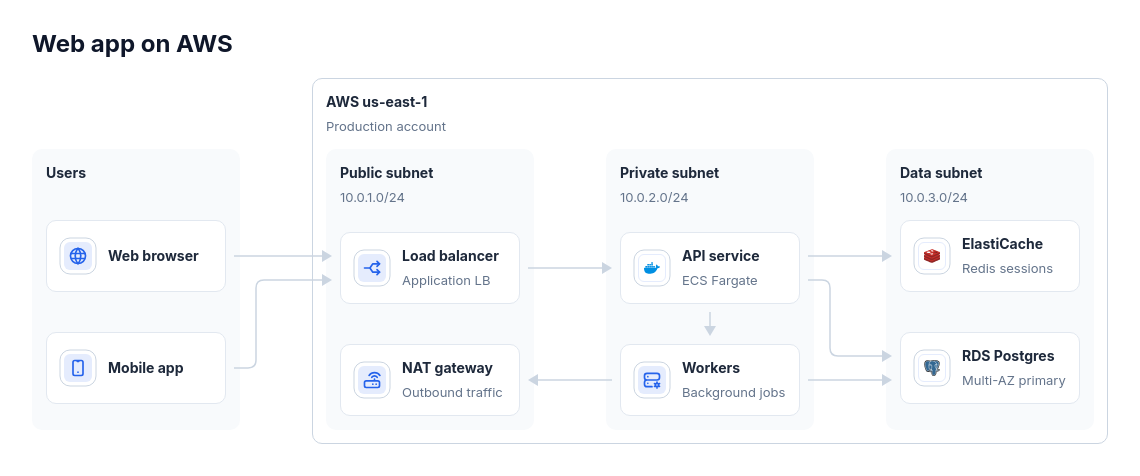 Architecture: grouped panels left to rightTwo to fourteen components placed in two to five networks, clusters, subnets, or accounts, such as an AWS VPC with public and private subnets or a Kubernetes cluster with namespaces, optionally inside one region with users or third-party services outside.