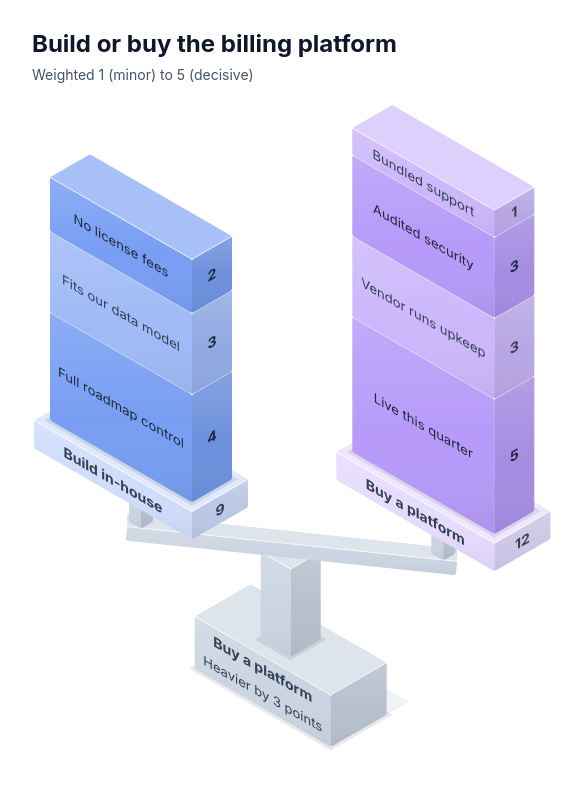
Diagram template
Comparison: solid isometric balance
PowerA solid isometric balance: a plinth and pillar carry a beam whose two ends hold level platforms on posts; each platform stacks one block per trait, its height exactly proportional to its whole-number weight, with the trait label on the block's front face and its weight on the end face, the side name and exact total on the platform, and the difference on the plinth. The heavier side drops 2° per point of difference, capped at 12°; equal totals keep the beam level.
Categories
Included in
Power, Max
When to use it
For weighing two options or positions by scored reasons, such as pros against cons, build against buy, benefits against risks, or two vendors, hires or locations, when each reason carries a 1-5 importance weight. Weights are judged importance, not measured amounts. Not for more than two sides, more than four reasons per side, unweighted lists or measured quantities with units.
Adjust after generating
Change the style, colors, and font, and these options, as often as you like without spending credits.
- Typography
- Spacing
What you fill in
Describe your topic in plain words and the AI fills these in. You can edit every field afterwards.
- Left
- Name and traits
- Right
- Name and traits
Related templates
All comparison templates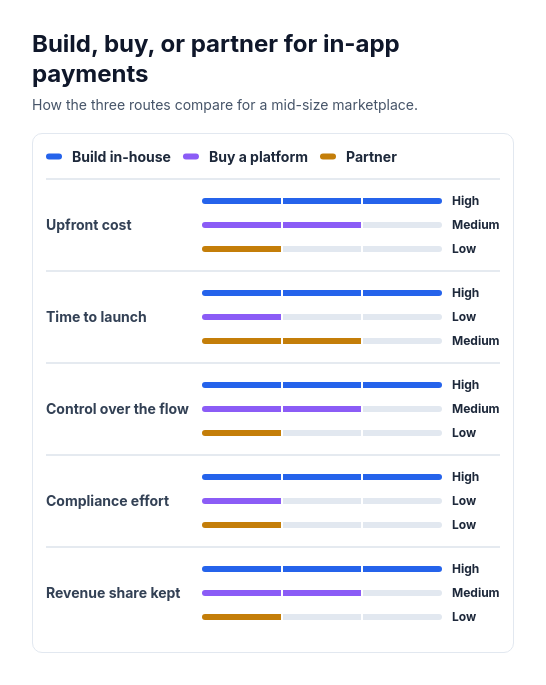 Attribute barsCompare two or three options across three to six attributes that can be scored or rated low, medium, or high, such as cost, speed, and effort.
 BenchmarkPlace one subject against a peer group's spread on two to eight metrics with different units: company or product benchmarks, a store or region against its network, salary or offer positioning against a market survey, a team or school against its organization.
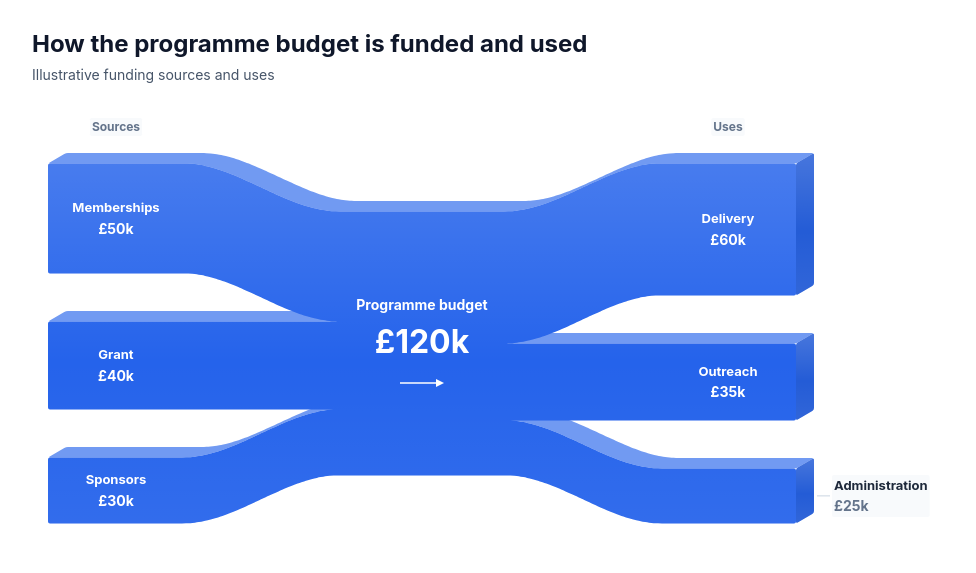 Conserved wholeTwo complete nonnegative marginal breakdowns of one positive common-unit total: funding sources and uses, staffing hours and work allocations, or energy supply and end uses.
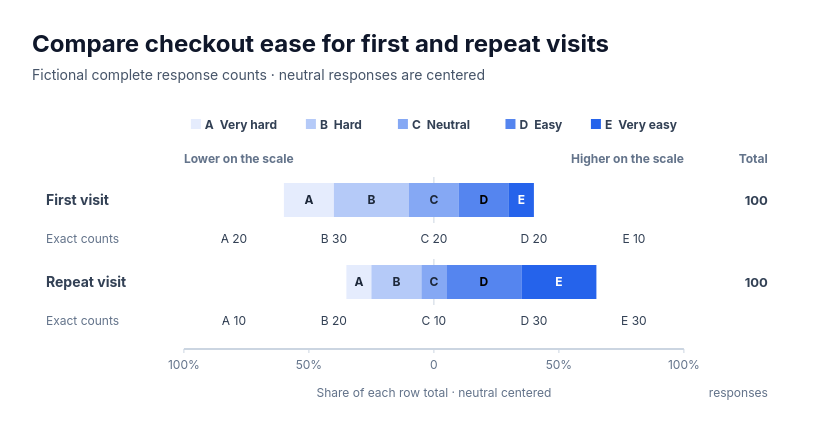 Chart: five-class ordered scaleFor complete supplied counts on one five-class ordered scale compared across two or three groups: survey agreement by segment, review star ratings by product, risk ratings by business unit, performance grades by team or difficulty ratings by release.
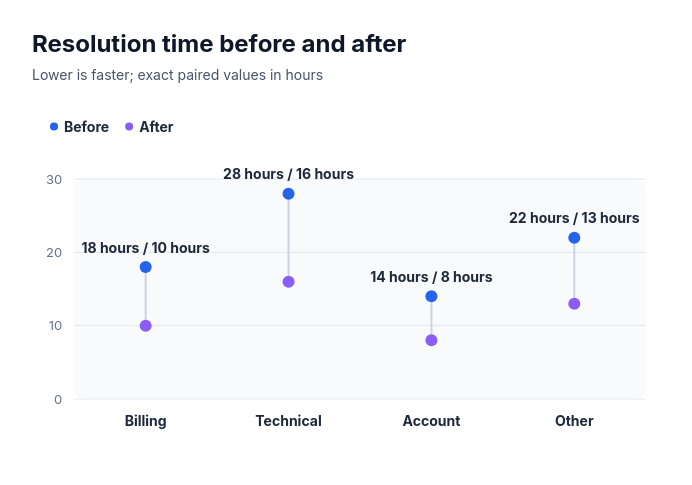 Dumbbell: vertical paired valuesCompare 2–8 paired signed finite before and after amounts as linked vertical points on one common axis.
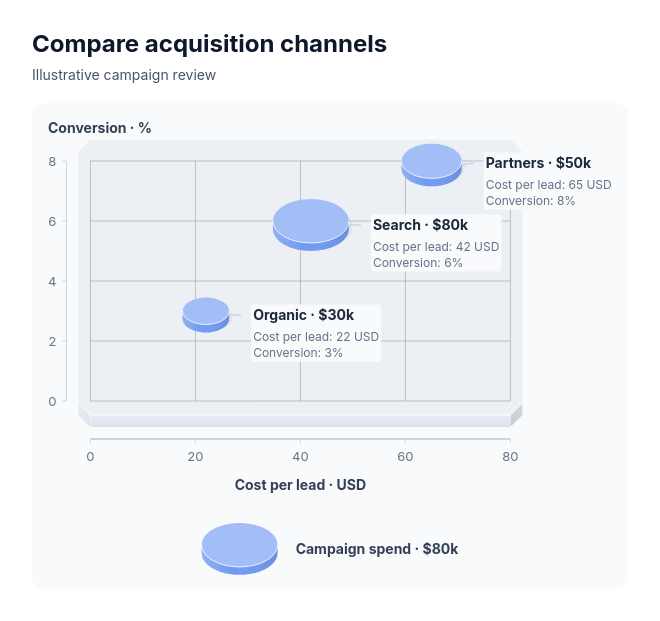 Bubble chartAcquisition channels by cost and conversion with spend, stores by traffic and sales with staffing, or products by growth and margin with revenue.