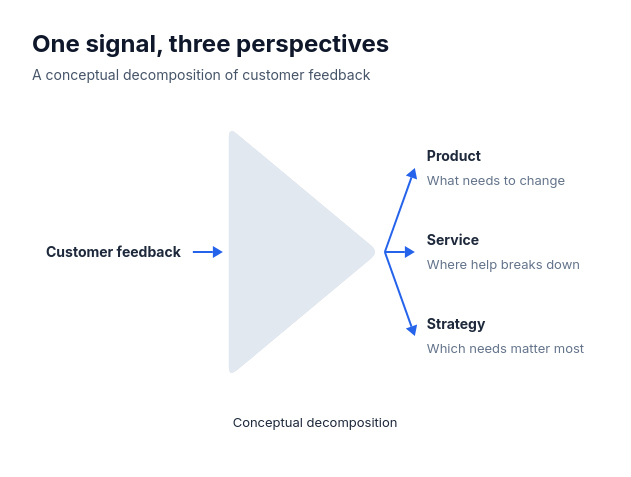
Diagram template
Prism
PowerDecompose one supplied input into 2–5 distinct output perspectives through a triangular prism. Inputs contains exactly one label up to 28 characters. Outputs have distinct labels up to 28 and independently optional specific descriptions up to 80. Rays express conceptual decomposition, not optical measurements or quantitative shares.
Categories
Included in
Power, Max
When to use it
Decompose one supplied input into 2–5 distinct output perspectives through a triangular prism. Inputs contains exactly one label up to 28 characters. Outputs have distinct labels up to 28 and independently optional specific descriptions up to 80. Rays express conceptual decomposition, not optical measurements or quantitative shares.
Adjust after generating
Change the style, colors, and font, and these options, as often as you like without spending credits.
- Card shape
- Card fill
- Card border
- Card shadow
- Typography
- Spacing
- Material
- Color distribution
What you fill in
Describe your topic in plain words and the AI fills these in. You can edit every field afterwards.
- Inputs
- Exactly 1
- Outputs
- 2 to 5, each with label and optional description
Related templates
All process templates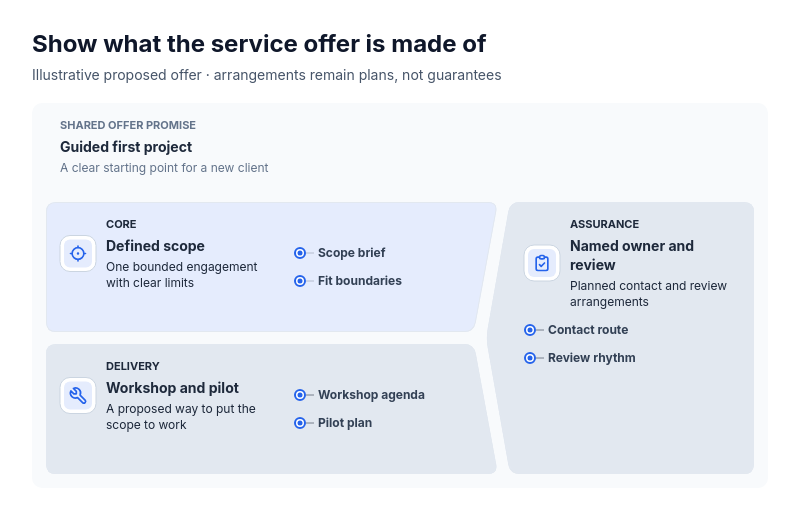 Anatomy: crowned subjectFor explaining what one thing is made of as a primary part, the part that carries it out and a part that spans both: a service offer (scope, delivery, assurance), a product (core function, how it ships, support), a course (content, format, learner support), an event (program, logistics, hosting) or a team charter (mission, ways of working, backing).
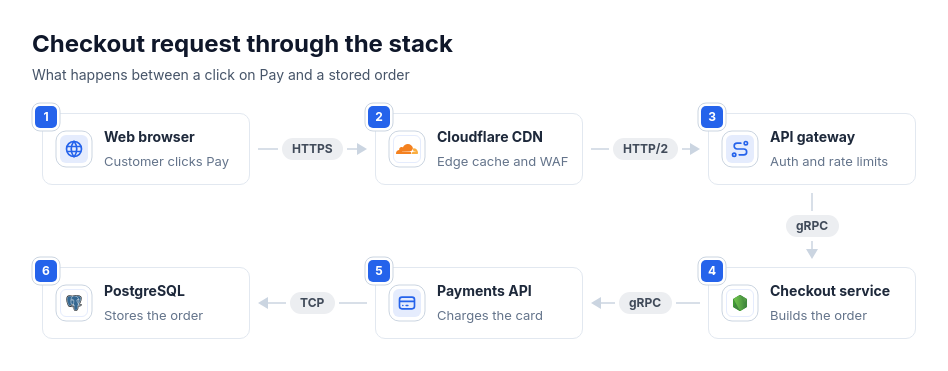 Architecture: request pathThree to eight hops of one request in order, such as a request through CDN, gateway, services, and database, an auth or checkout request trace, or a webhook delivery path, optionally with the protocol or measured time of each link.
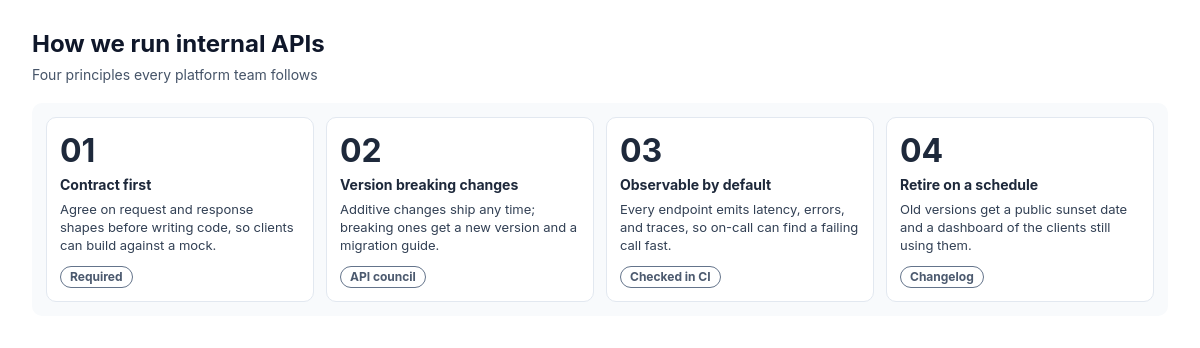 Numbered takeaways with optional footnotesParallel principles or takeaways.
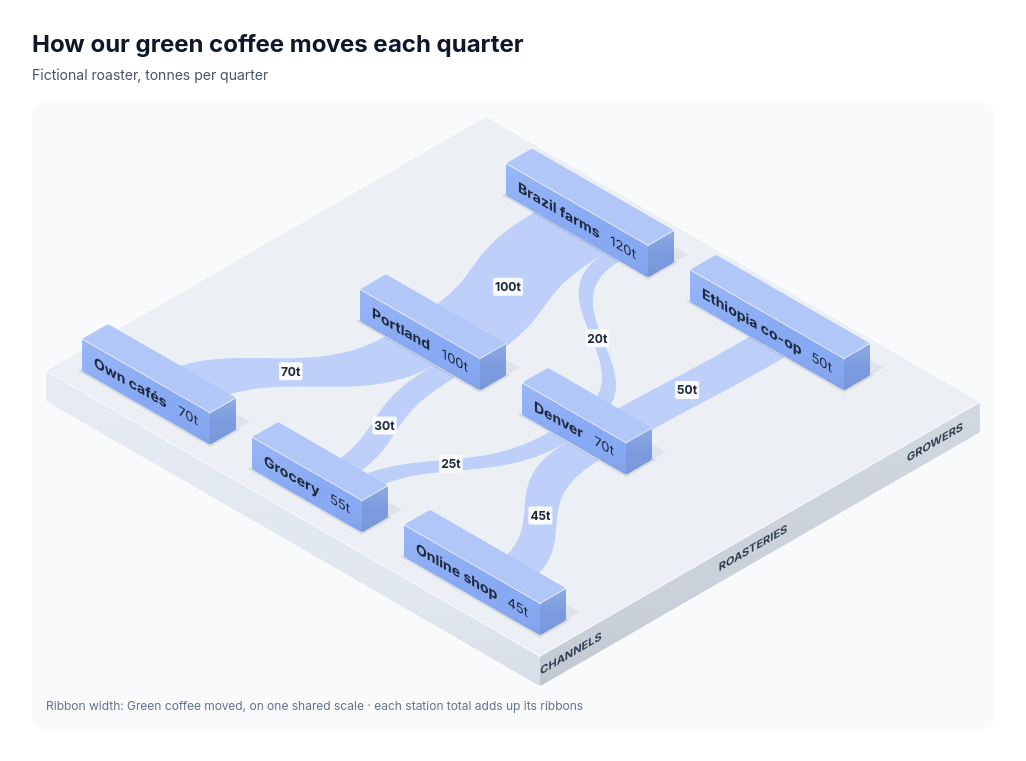 Chart: isometric station platforms in stage columnsOne measured quantity moving through a chain of stages where every middle station passes on exactly what it receives: supply chain volumes from suppliers through plants to stores, data moving between systems in a pipeline, students moving from intake routes through programmes into destinations.
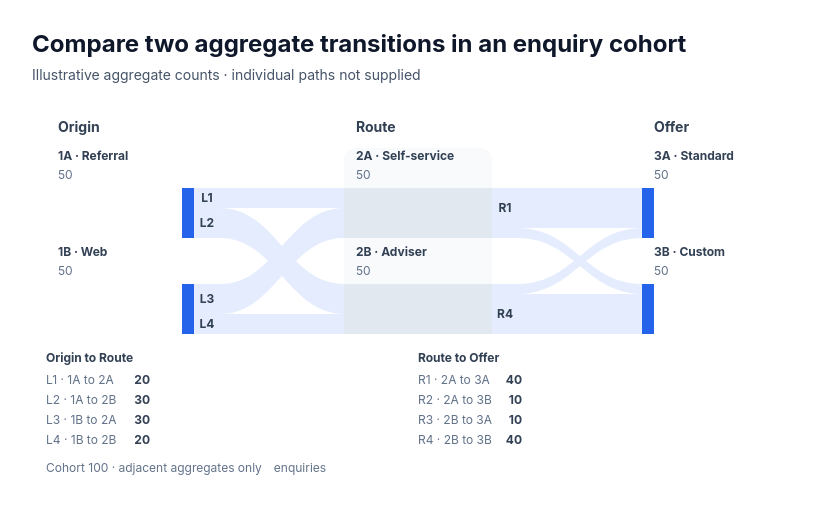 Chart: adjacent aggregate transfersFor an explicitly closed conserved cohort classified into two categories at each of three ordered stages, with all eight adjacent pair counts including known zeros: enquiries by origin, route and offer; students by entry track, course and outcome; patients by referral, pathway and setting; or orders by channel, warehouse and carrier.
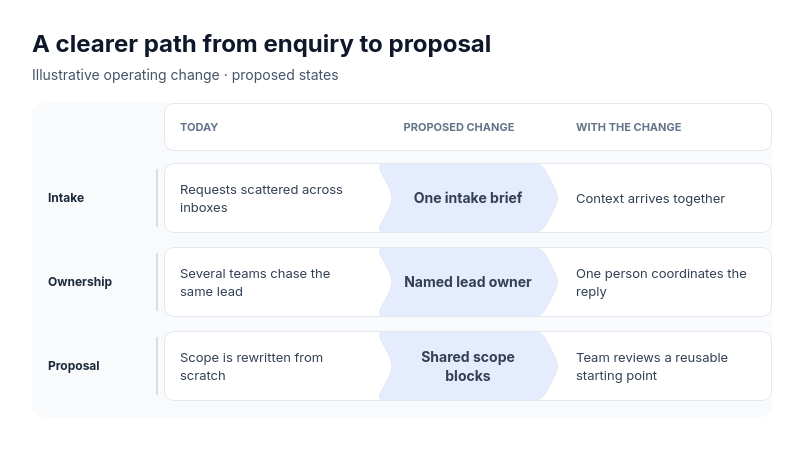 Comparison: paired statesFor proposals explaining which specific change connects each current condition to its proposed counterpart: a business process redesign, a product onboarding fix, a policy or classroom routine change, a team operating model, or a personal workflow.