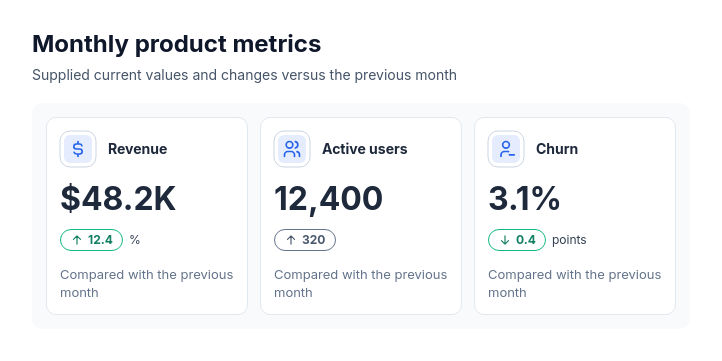
Diagram template
Stats: icon card row
Two to five measured icon cards align exact supplied display values, independently optional numeric change pills with explicit direction and favorability, separate supplied change units and context notes.
Categories
Included in
Free, Pro, Power, Max
When to use it
Use for supplied dashboard KPI sets such as revenue, active users, churn and latency. Changes may be incomplete and remain neutral unless favorability is supplied. Suits separate headline metrics rather than a time-series plot or composition of one whole. Requires known numeric current values; never invent missing measurements or intervals.
Adjust after generating
Change the style, colors, and font, and these options, as often as you like without spending credits.
- Card shape
- Card fill
- Color distribution
- Card border
- Card shadow
- Typography
- Icon shape
- Icon size
- Icon fill
- Icon shell
- Spacing
- Alignment
- Material
What you fill in
Describe your topic in plain words and the AI fills these in. You can edit every field afterwards.
- Cards
- 2 to 5, each with label, value, icon, optional delta, optional direction, optional delta unit, optional tone, and optional description
Related templates
All stats templates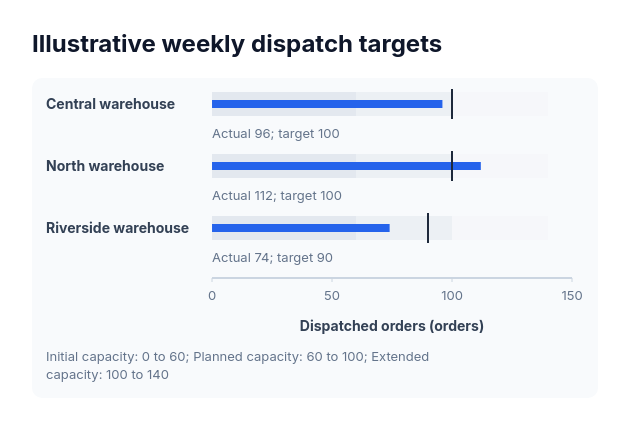 BulletActual-versus-target values sharing one nonnegative scale and explicitly supplied range boundaries.
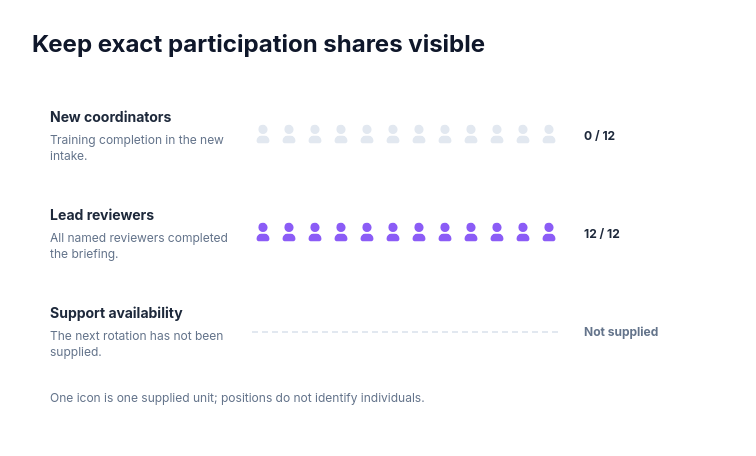 Chart: exact unit sharesFor program attendance, licensed accounts or project staffing expressed as small exact counts.
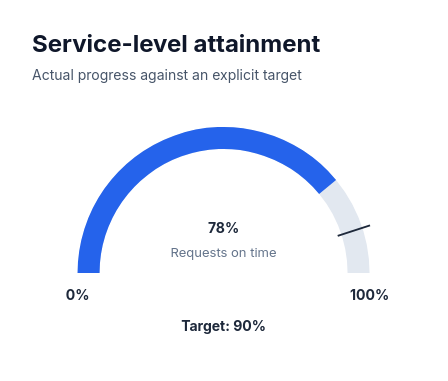 GaugeShow a supplied finite value on an explicitly bounded semicircular scale.
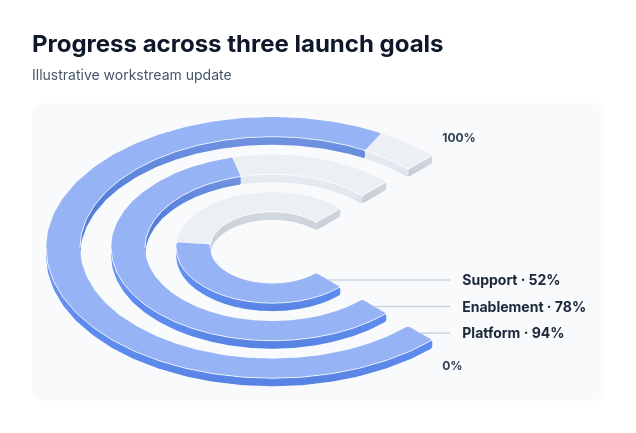 ProgressIndependent launch workstreams, fundraising targets, training completion or sustainability commitments.
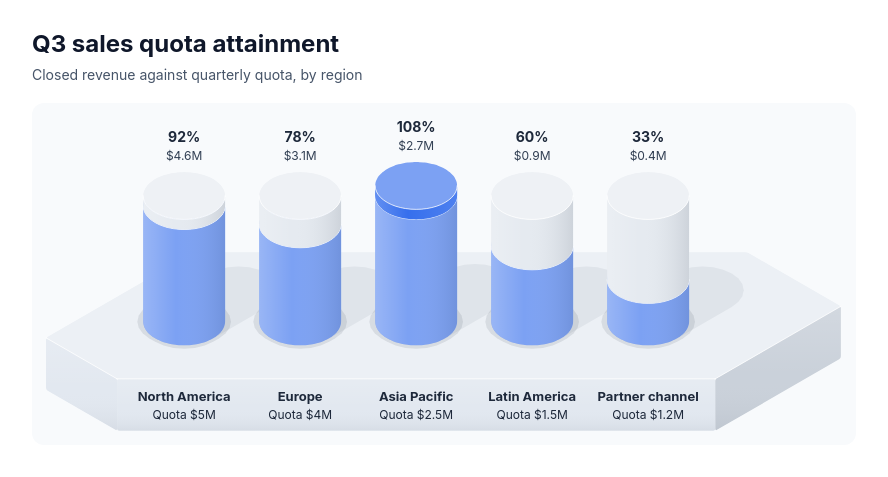 Progress chartSeveral measures each tracked against its own target, compared by the share reached: sales quota attainment by region or rep, fundraising toward campaign goals, OKR key results, migration or rollout completion, hiring against plan.
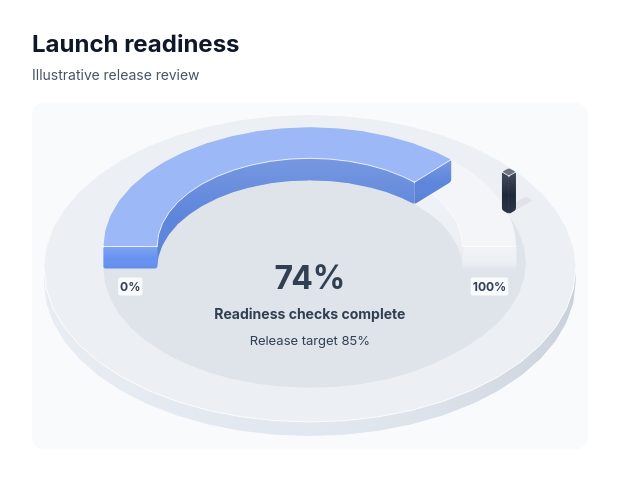 Chart: isometric semicircle gaugeA single bounded measure with an explicit target: quota attainment, project completion or capacity use.