Coordinate plane maker
Set independent X and Y grid bounds, plot points, connect line segments, or print blank graph paper worksheets. Download crisp SVG or PNG diagrams instantly without an account.
Blank coordinate plane & graph paper worksheets
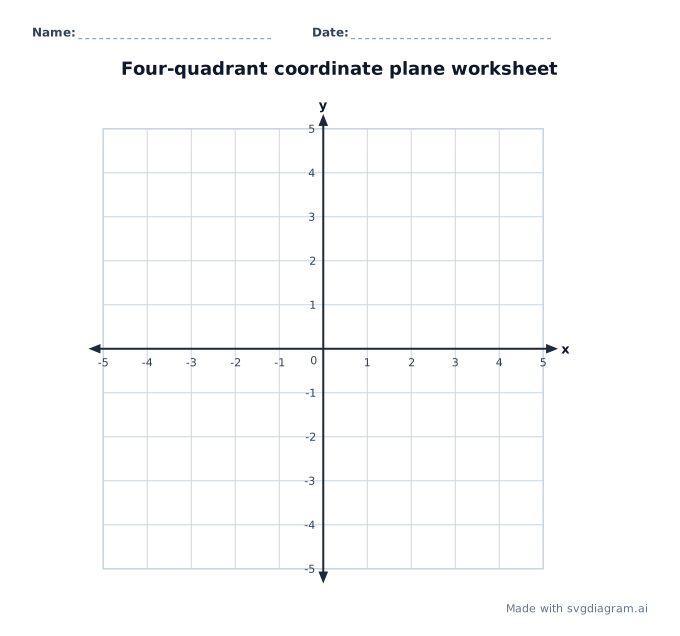
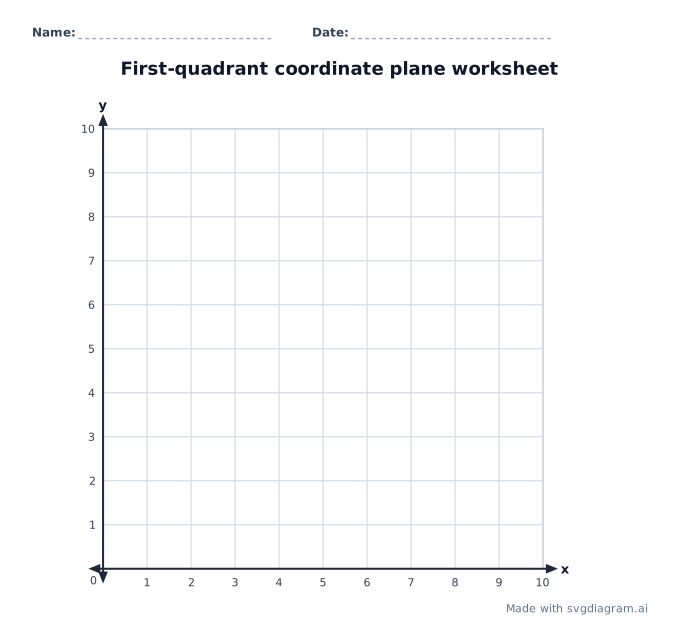
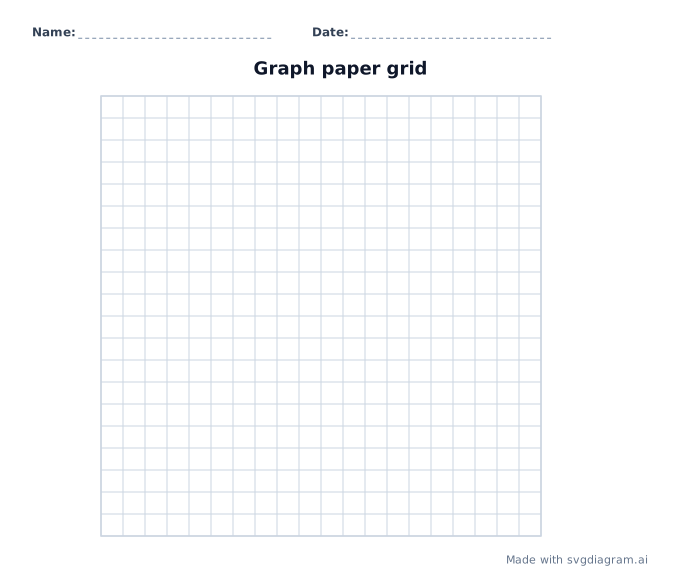
Print blank four-quadrant, first-quadrant, or graph paper grids for student assignments. Name and date lines are included. Printing saves directly to PDF.
Coordinate plane examples
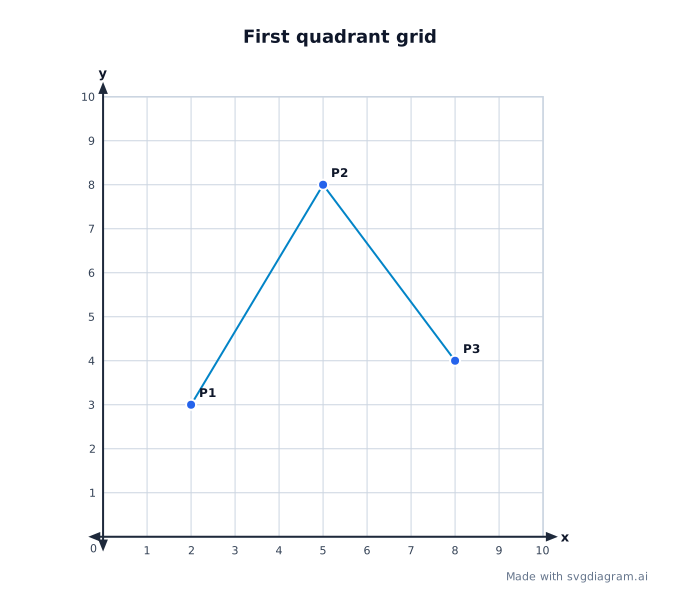
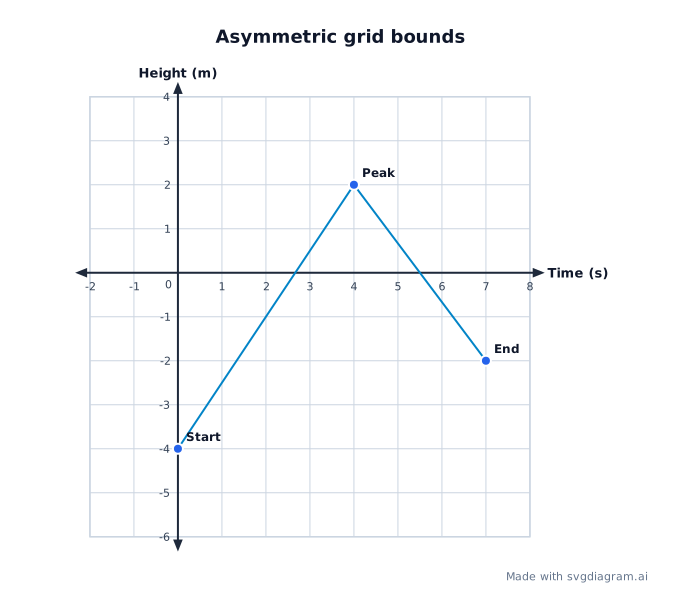
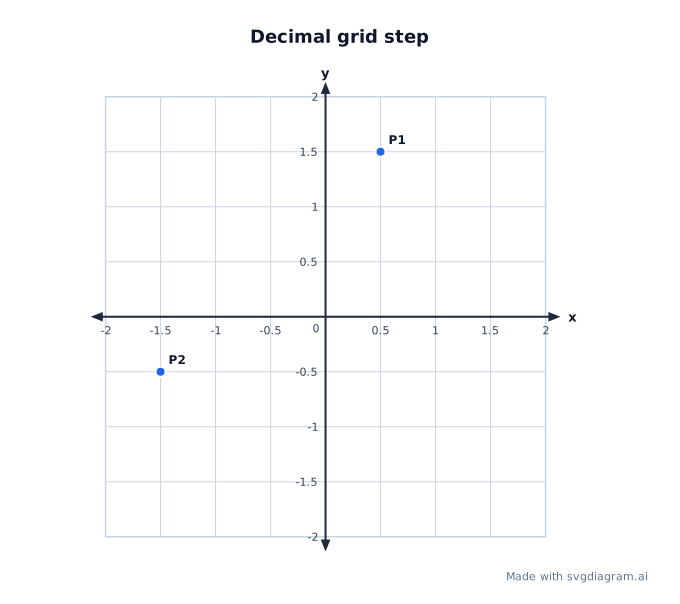
Open four-quadrant, first-quadrant, asymmetric, or decimal grid presets.
How to read a coordinate plane
What a coordinate plane shows
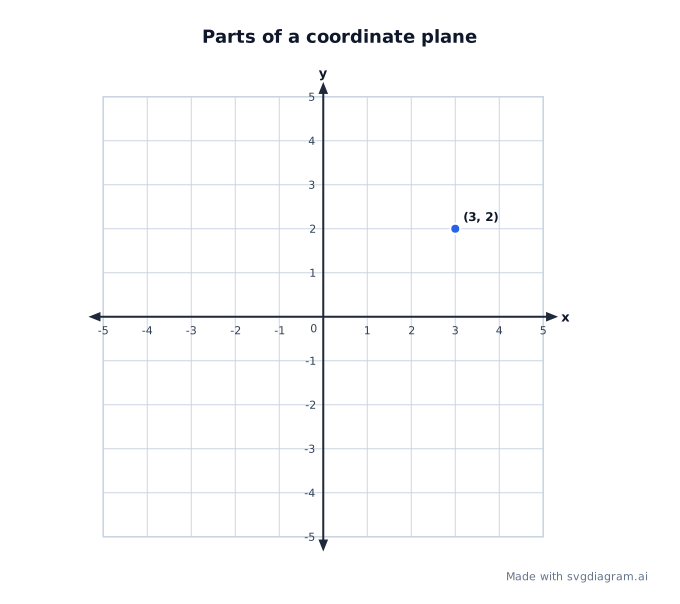
A coordinate plane is a two-dimensional grid formed by the intersection of a horizontal axis (X-axis) and a vertical axis (Y-axis), crossing at the origin (0, 0) (AMSI Coordinate Geometry).
The perpendicular axes divide the plane into four quadrants:
- Quadrant I: Top-right, where both X and Y coordinates are positive (+, +).
- Quadrant II: Top-left, where X is negative and Y is positive (-, +).
- Quadrant III: Bottom-left, where both X and Y coordinates are negative (-, -).
- Quadrant IV: Bottom-right, where X is positive and Y is negative (+, -).
Customizing grid bounds and step size
In middle school mathematics, students position rational numbers on coordinate axes (CCSS 6.NS.C.6.C) and graph points across all four quadrants to solve mathematical and real-world problems (CCSS 6.NS.C.8).
Adjust the grid to suit your exercise:
- Independent X and Y ranges: Set asymmetric bounds such as X from -2 to 8 while Y spans -6 to 4.
- Decimal grid steps: Choose steps such as 0.5 or 0.25 to plot non-integer coordinates accurately.
- Custom axis labels: Name axes with physical units such as "Time (s)" or "Height (m)".
- Equal unit scaling: Preserves physical square grid units so shapes maintain true geometric proportions.
Plotting points and connecting segments
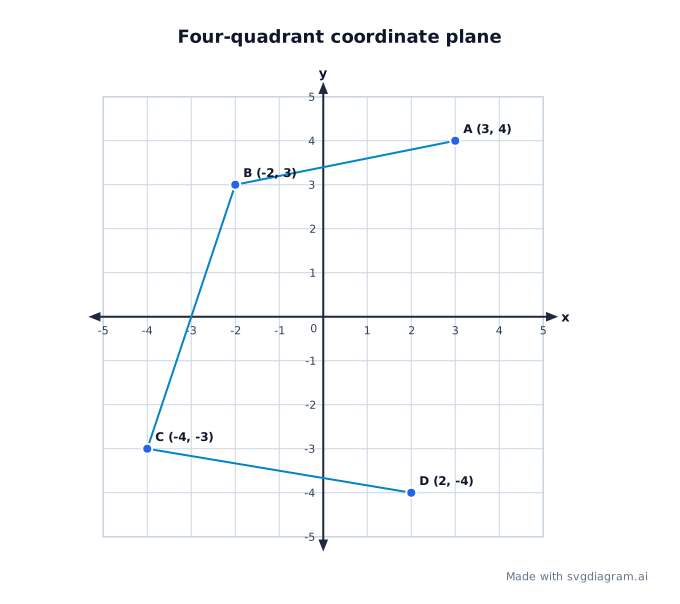
Every point on the grid is designated by an ordered pair (X, Y). Type up to 20 coordinates into the points table.
- Point labels: Assign custom letter labels or point names (such as "A (3, 4)").
- Connected line segments: Join points in the order entered. Repeat the first point at the end to close a polygon. The maker does not plot equations or calculate a best-fit line.
- Tick labels: Dense grids show numbers at regular intervals. A note on the diagram explains when labels are skipped; the grid spacing stays unchanged.
How to use the maker
- Choose a preset or select your desired grid mode (Coordinate Plane or Graph Paper).
- Set X Min, X Max, Y Min, Y Max, and the grid step.
- Enter coordinate rows (X, Y, and optional label) to mark points on the plane.
- Toggle Worksheet mode to print blank practice sheets with Name and Date lines.
- Download high-resolution SVG for vector editing or PNG for Google Docs and PowerPoint.
Enter decimal numbers, including negative values. Fractions such as 1/2 and scientific notation are not accepted; enter 0.5 instead. Bounds must stay between -10,000 and 10,000, with at most 100 grid intervals on either axis and 20 point rows. Labels that cannot fit and extremely narrow grids show an error rather than exporting a clipped diagram.
Print blank graph paper and worksheets
Printable worksheets omit plotted answers while preserving grid lines, axis markings, title, and student Name/Date lines. Choose between four-quadrant planes, first-quadrant grids, or plain graph paper.
Exporting for documents and presentations
Exported SVG files maintain crisp vector paths at any scaling size. PNG images can be pasted directly into Word, Slides, or learning management software.
For values on one axis, use the number line maker. To compare sets, use the Venn diagram maker.
Explore other diagram types
Templates for each type, filled in from a description of your content.