Dot plot maker
Enter raw observations to plot stacked dots over a number line. Print blank worksheets, customize labels and colors, and download SVG or PNG. Free with no account.
Enter up to 200 signed integers or decimals (up to 6 decimal places). Raw numbers only: no fractions (1/2), scientific notation (1e3), or thousands separators (1,000).
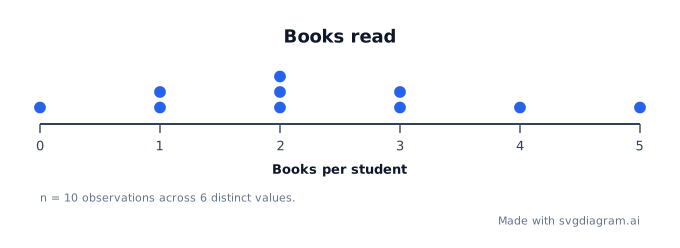
Range 0 to 5 (step 1) · 6 ticks · 10 dots across 6 values (max stack: 3)
Blank dot plot worksheets
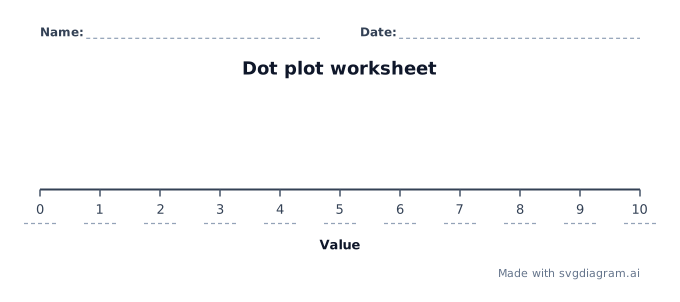
Print a blank dot plot worksheet for classwork or exercises. Name and date lines are included. Printing saves directly to PDF.
Dot plot examples
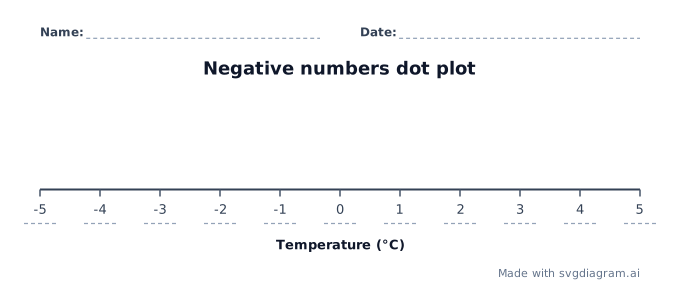
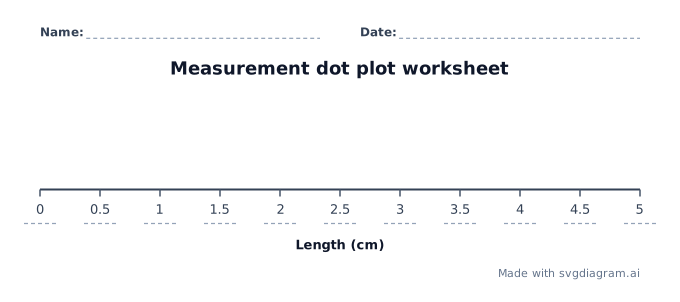
Open books read, negative temperatures, decimal growth lengths, quiz scores, or household pet counts.
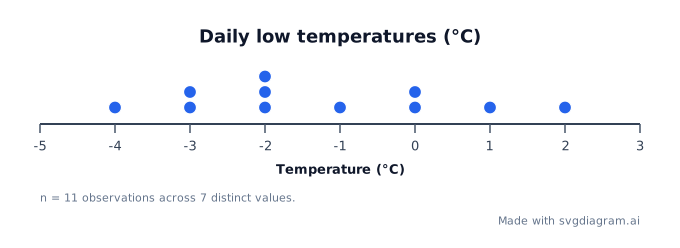
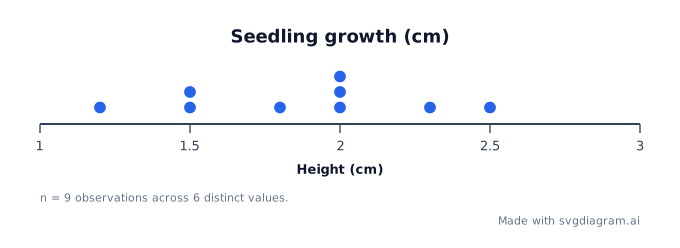
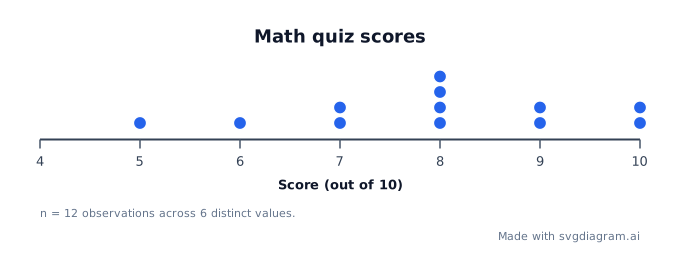
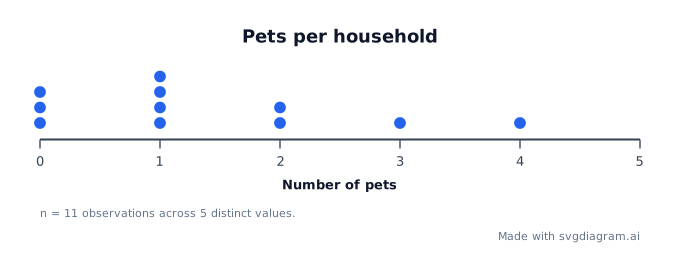
How to read a dot plot
What a dot plot shows
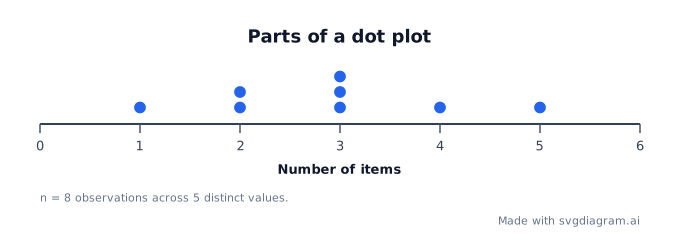
A dot plot (also known as a line plot in elementary statistics) displays individual numerical observations as dots stacked vertically above a number line. Each dot represents a single observation, making cluster shape, center, spread, and frequency distribution visible at a glance.
Unlike categorical bar charts or binned histograms, a statistical dot plot preserves exact individual values and plots dots over their true numeric positions along a continuous scale.
Working with integers, negatives, and decimals
Dot plots summarize small to moderate numerical data sets. Common Core 6.SP.B.4 requires students to display numerical data in plots on a number line, including dot plots.
You can enter up to 200 raw numerical observations (signed integers or decimals up to 6 decimal places). Numbers must be entered in raw numeric format without fractions (such as 1/2), scientific notation (such as 1e3), or thousands separators (such as 1,000). The maker automatically computes nice axis bounds and step increments, or you can specify custom minimum, maximum, and step values.
How to use the maker
- Enter raw observations separated by commas, semicolons, or spaces (e.g.
0, 1, 1, 2, 2, 2, 3, 3, 4, 5). - Set optional diagram title and X-axis label (e.g.
Books readandBooks per student). - Leave axis bounds blank for automatic axis calculation, or set custom minimum, maximum, and step.
- Choose dot colors, font face, text size, and canvas background.
- Toggle worksheet mode to print blank axis grids for classroom assignments.
- Download sharp vector SVG or high-resolution PNG for slides, worksheets, and documents.
The maker supports up to 200 raw observations and up to 101 axis tick marks. If tick labels would collide, ticks are automatically thinned on a regular stride with an explanatory note.
Print a blank dot plot worksheet
Blank worksheets keep the axis line, tick marks, tick labels, axis title, and Name/Date header lines, while omitting data dots. Students can plot observations manually during class exercises or exams.
Related educational tools
For continuous ranges, intervals, or fractions without frequency stacks, use the Number line maker. For categorical side-by-side data, explore our T-chart maker.
Explore other diagram types
Templates for each type, filled in from a description of your content.