Diagram template
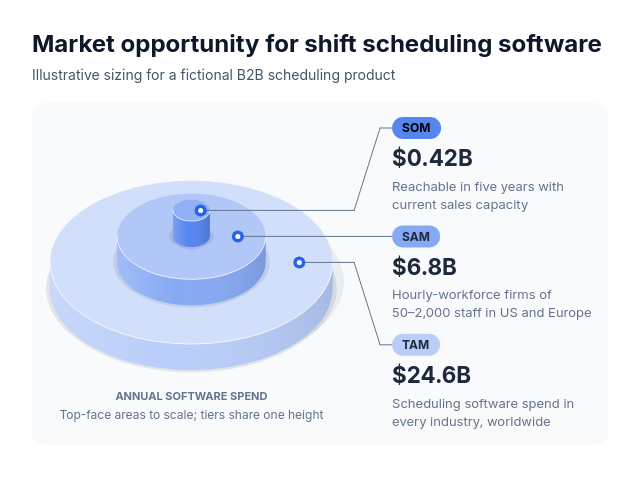
Market sizing: isometric stacked cylinder tiers
MaxTwo to four projected cylinder tiers of equal height stacked concentrically on a round board, the largest level at the bottom, each tier's top-face area exactly proportional to its supplied amount, so the ring each tier leaves exposed is the part of it outside the next level. Upright labels beside the stack hold each level's name, exact amount and optional description, with a leader to a marker on that tier's exposed ring; the board's front names the measured quantity.
Categories
Included in
Max
When to use it
Suits nested sizes of one quantity where each level is a subset of the one below it, when a solid presentation look suits the slide: total, serviceable and obtainable market (TAM, SAM, SOM), addressable users narrowing to reachable and converted users, a sales universe narrowing to qualified pipeline, or a total budget narrowing to allocated and spent. Amounts share one unit, are positive and never increase upward; tier height is equal and carries no data. Not for independent categories, parts of a whole side by side, overlapping sets, zero levels or precise reading of small differences; use a donut, treemap, Venn or the flat nested circles for those.
Adjust after generating
Change the style, colors, and font, and these options, as often as you like without spending credits.
- Typography
- Spacing
- Color distribution
What you fill in
Describe your topic in plain words and the AI fills these in. You can edit every field afterwards.
- Value label
- Text
- Layers
- 2 to 4, each with label, value, and optional description
- Prefix
- Text
- Suffix
- Text
Related templates
All chart templates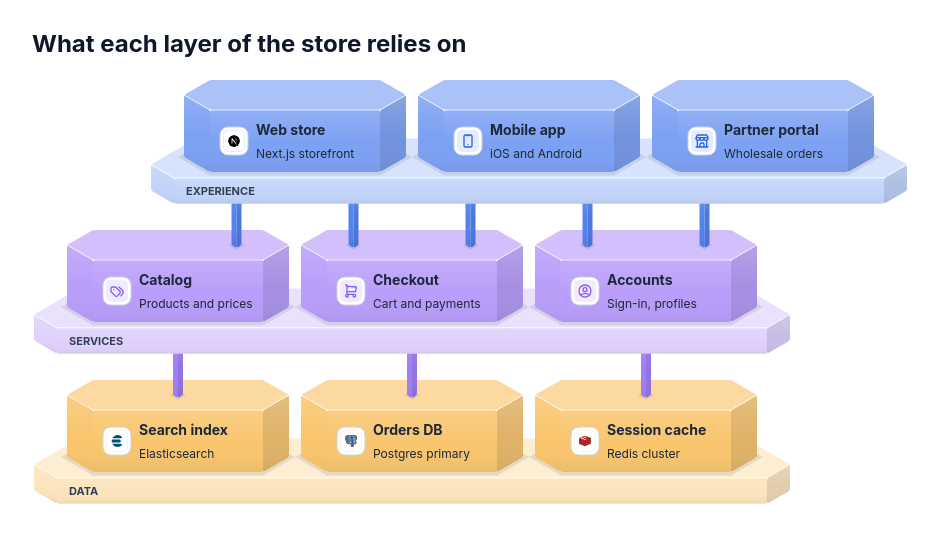 Architecture: isometric floating layer plates stacked with a clear gapA layered system where components rely on specific components in the layer directly below: software layers from experience through services to data, an operating model from strategy through operations to delivery teams, or a data stack from reports through warehouse and pipelines to sources.
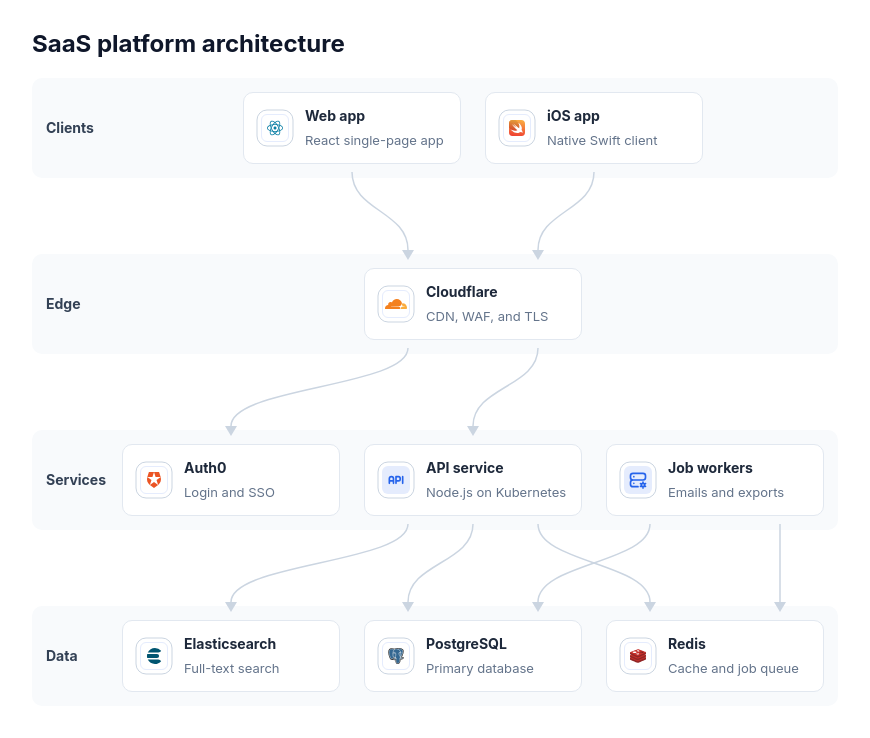 Architecture: stacked layer bandsA system of two to sixteen components arranged in two to five layers, such as a web app's stack or a SaaS platform from clients through edge and services to data, with calls between neighboring layers.
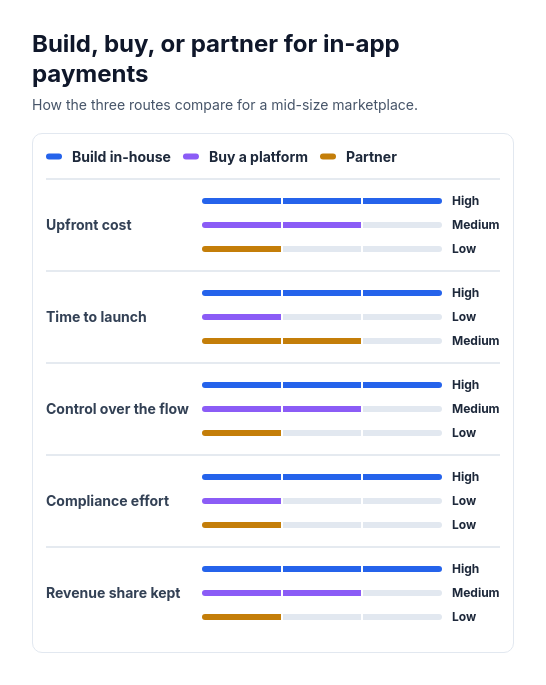 Attribute barsCompare two or three options across three to six attributes that can be scored or rated low, medium, or high, such as cost, speed, and effort.
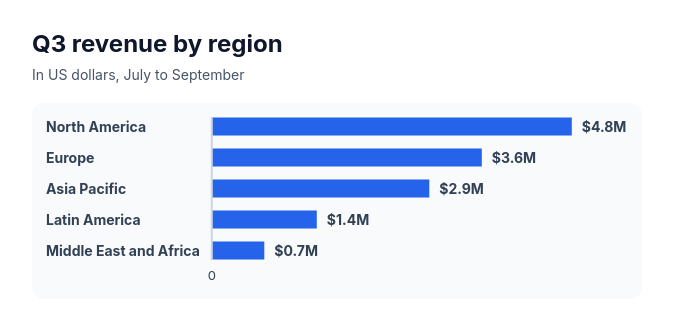 Bar chartCompare three to ten amounts of the same kind, such as sales by region, survey answers, or time per task.
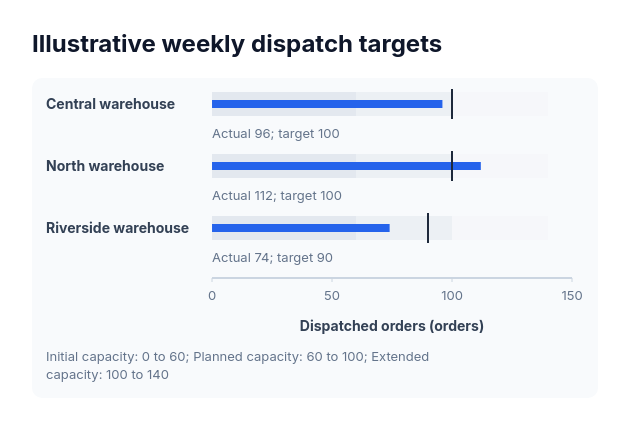 BulletActual-versus-target values sharing one nonnegative scale and explicitly supplied range boundaries.
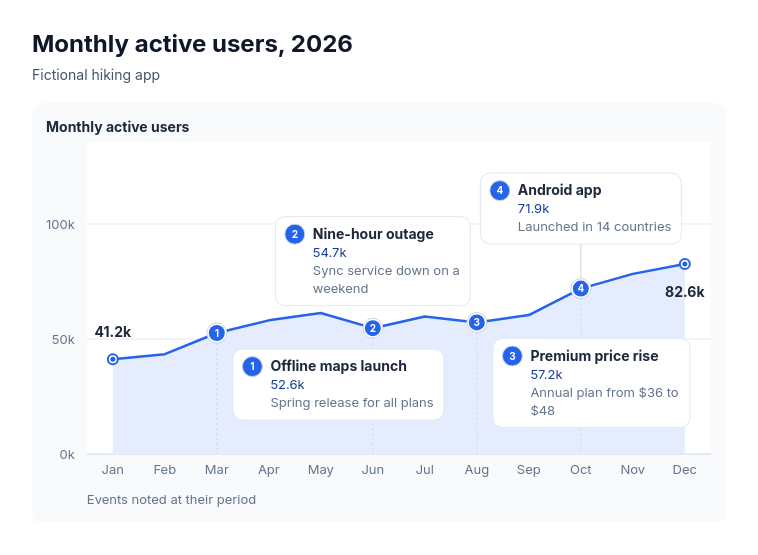 Annotated lineSuits explaining the turns in one measure over time: monthly active users with launches and outages, revenue with pricing changes, support volume with policy changes, website traffic with campaigns, headcount with reorganisations.