Diagram template
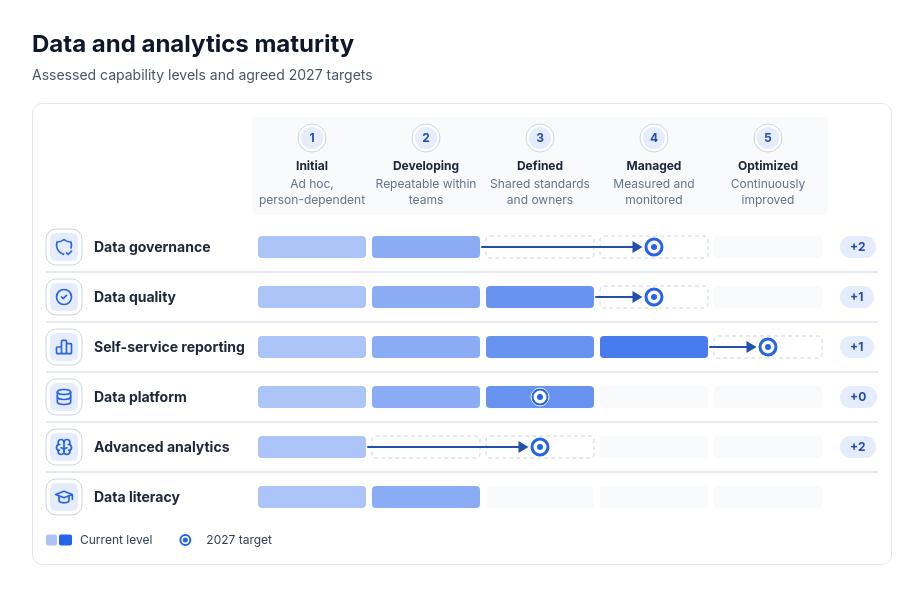
Maturity grid
PowerA grid of four or five ordered, numbered level columns with optional descriptors over three to seven rows. Each row fills separated level steps up to its current level; an optional target level carries a ring marker, dashed planned steps, an arrow across the gap and a +N gap pill. A key names the current and target marks.
Categories
Included in
Power, Max
When to use it
Use to show where several capabilities, teams or practices stand on one ordered maturity scale and how far each must go: digital or data maturity, security posture, sales enablement, process or skills readiness. Levels are ordered steps, not measured scores. Not for numeric KPIs against targets, for comparing options on criteria, or for timelines and roadmaps.
Adjust after generating
Change the style, colors, and font, and these options, as often as you like without spending credits.
- Card shape
- Card border
- Card shadow
- Typography
- Spacing
- Icon shape
- Icon size
- Icon shell
- Material
What you fill in
Describe your topic in plain words and the AI fills these in. You can edit every field afterwards.
- Levels
- 4 to 5, each with name and optional description
- Rows
- 3 to 7, each with name, optional icon, current level, and optional target level
- Current label
- Text
- Target label
- Text
Related templates
All matrix templates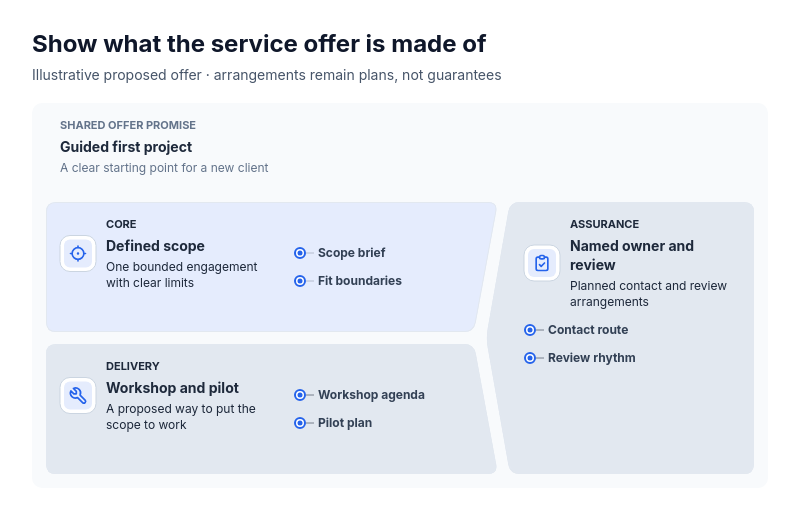 Anatomy: crowned subjectFor explaining what one thing is made of as a primary part, the part that carries it out and a part that spans both: a service offer (scope, delivery, assurance), a product (core function, how it ships, support), a course (content, format, learner support), an event (program, logistics, hosting) or a team charter (mission, ways of working, backing).
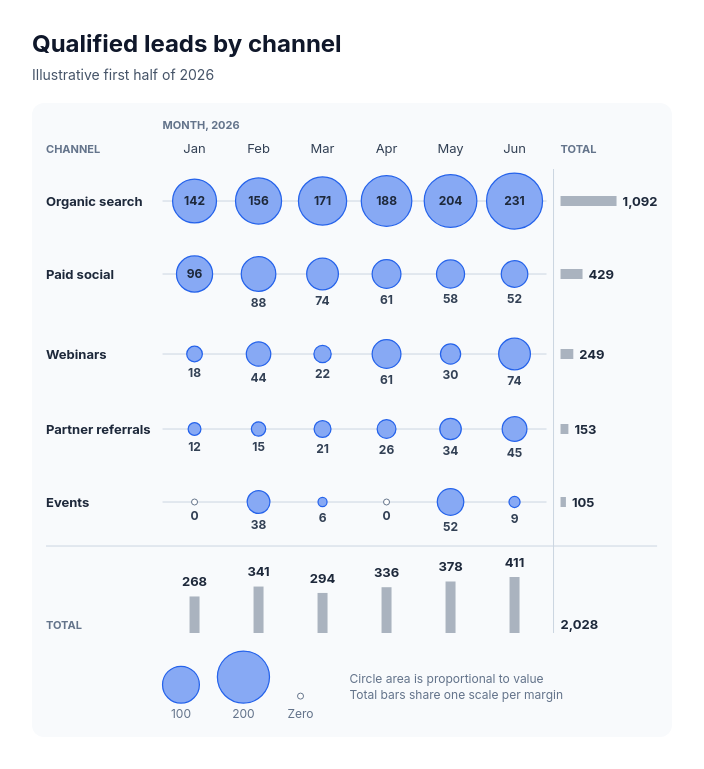 Chart: bubble gridShow how one additive measure spreads across two lists when the pattern of large and small amounts matters more than exact shades, such as leads by channel and month, feature usage by customer segment, skills by team, or orders by store and weekday.
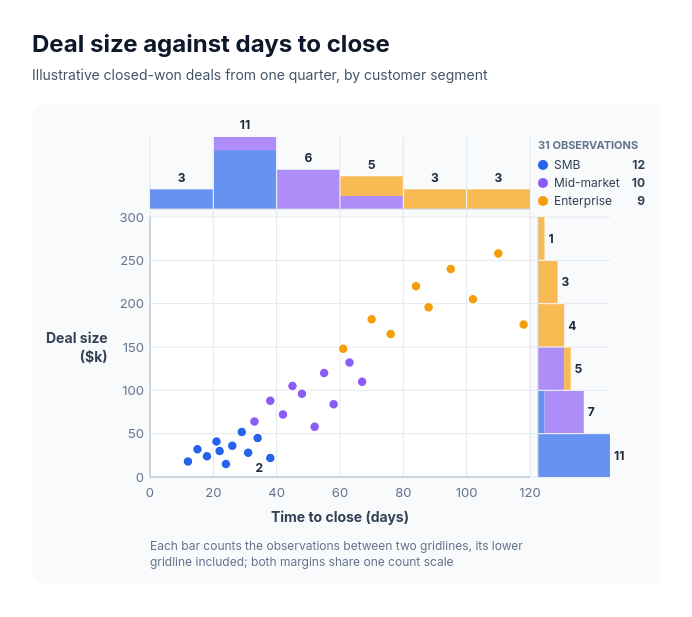 Chart: scatter plotShow how two measures relate across many observations and how each one is distributed, such as deal size against days to close by segment, delivery time against distance by region, customer tenure against monthly spend by plan, or response time against satisfaction score by channel.
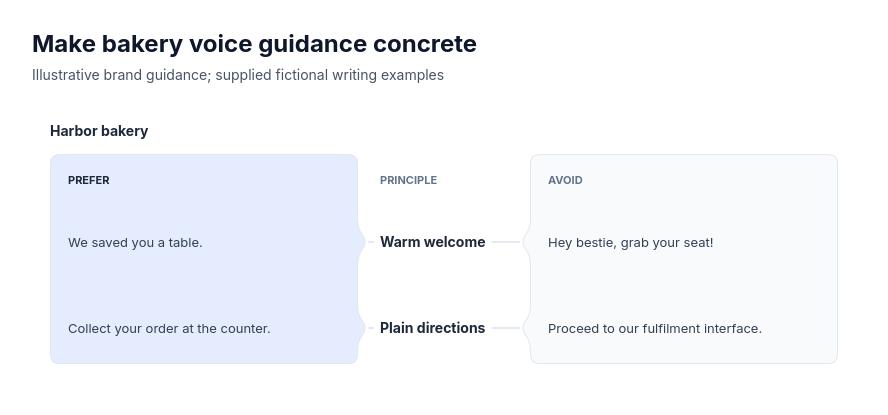 Comparison: principle seamsFor two to four supplied principles, each owning one exact preferred example and one exact example to avoid: brand voice guides, product interface copy, support reply standards, documentation style, naming conventions, inclusive language or meeting etiquette.
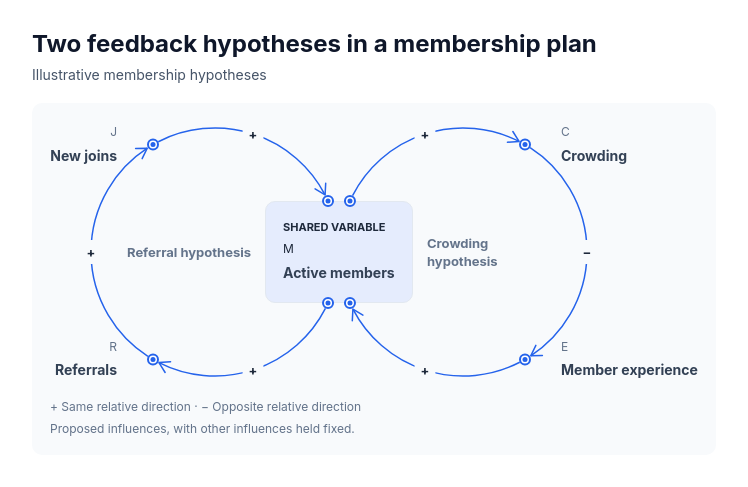 Cycle: causalFor a compact qualitative causal-loop view with exactly five variables and two three-link loops sharing one variable: a referral loop against crowding in a membership plan, workload against hiring in a team, adoption against support load in a product, or demand against price in a market.
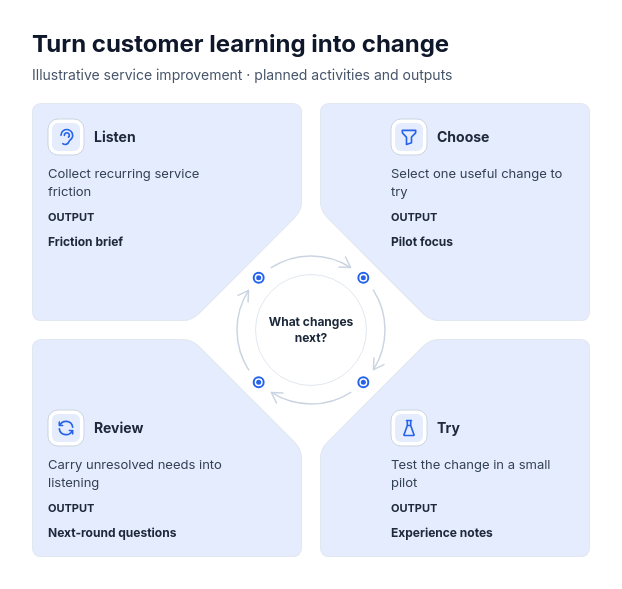 Cycle: quarter panelsFor four-step recurring loops where each step produces one named output: service improvement, editorial planning, quarterly operating reviews, product discovery or a study-practice-test-reflect learning cycle.