Diagram template
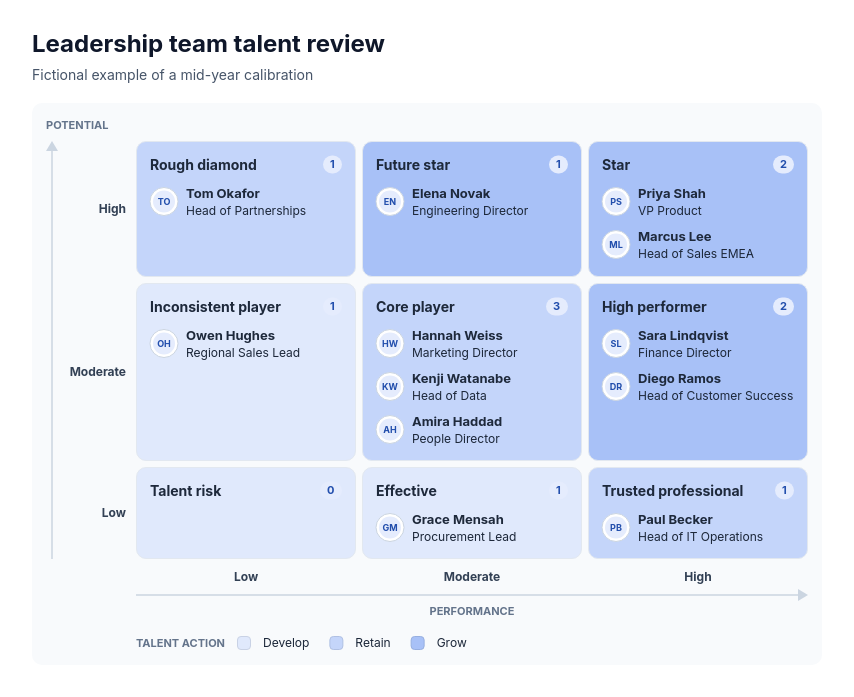
Nine-box grid
PowerA three-by-three grid of cells formed by two axes of three ordered levels, shaded in one accent that deepens as both levels rise. Each cell has an optional name and a count pill, and lists its entries as initials avatars with names and optional descriptions. Axis arrows, level labels and captions frame the grid.
Categories
Included in
Power, Max
When to use it
Use to place named people, businesses, accounts, suppliers or products into the cell of two supplied three-level assessments: talent reviews (performance against potential), GE-McKinsey style portfolios (attractiveness against strength), account or supplier segmentation. Levels are categories, not scores. Not for numeric positions (use a scatter or quadrant plot), for two-by-two classifications or for more than four entries per cell.
Adjust after generating
Change the style, colors, and font, and these options, as often as you like without spending credits.
- Card shape
- Card border
- Card shadow
- Typography
- Spacing
- Icon fill
- Avatar shape
What you fill in
Describe your topic in plain words and the AI fills these in. You can edit every field afterwards.
- X axis
- Label and level names
- Y axis
- Label and level names
- Level label
- Text
- Level names
- 2 to 4
- Cells
- Exactly 9, each with column, row, name, and optional level
- Entries
- 3 to 18, each with name, optional description, optional icon, column, and row
Related templates
All matrix templates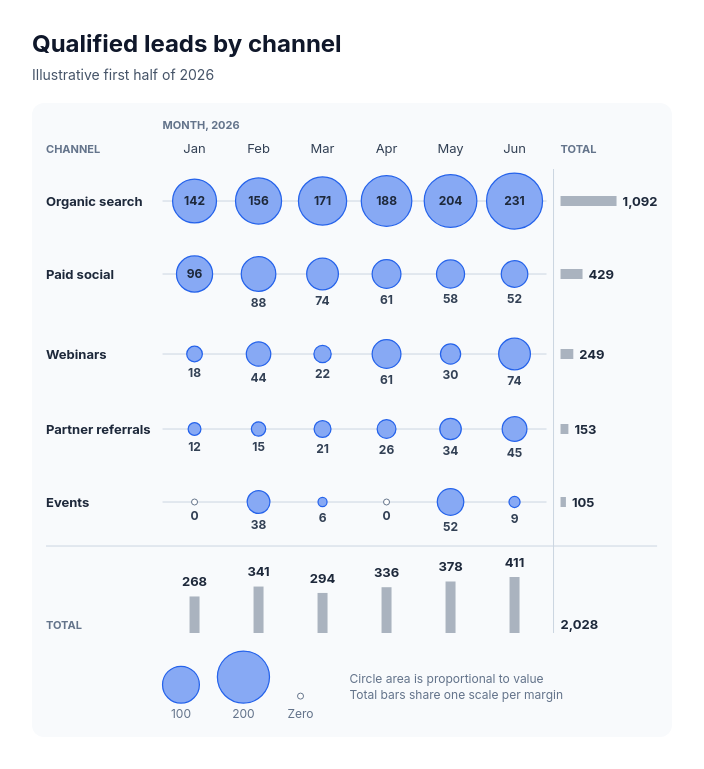 Chart: bubble gridShow how one additive measure spreads across two lists when the pattern of large and small amounts matters more than exact shades, such as leads by channel and month, feature usage by customer segment, skills by team, or orders by store and weekday.
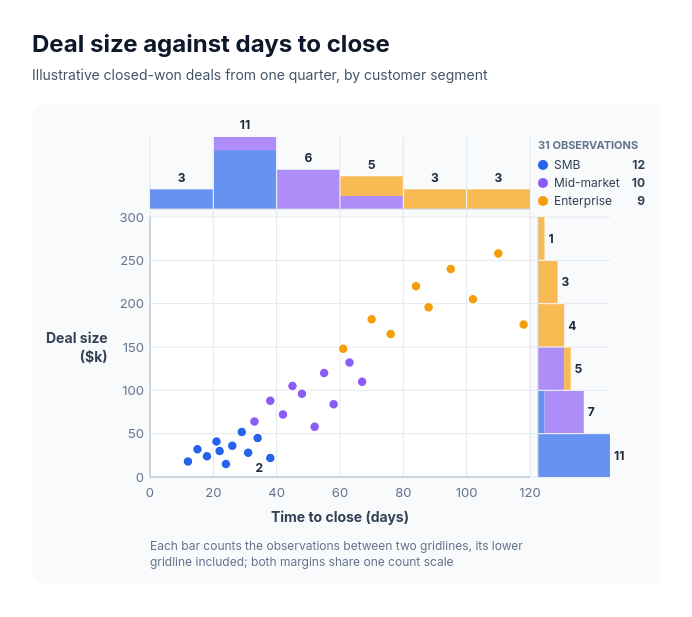 Chart: scatter plotShow how two measures relate across many observations and how each one is distributed, such as deal size against days to close by segment, delivery time against distance by region, customer tenure against monthly spend by plan, or response time against satisfaction score by channel.
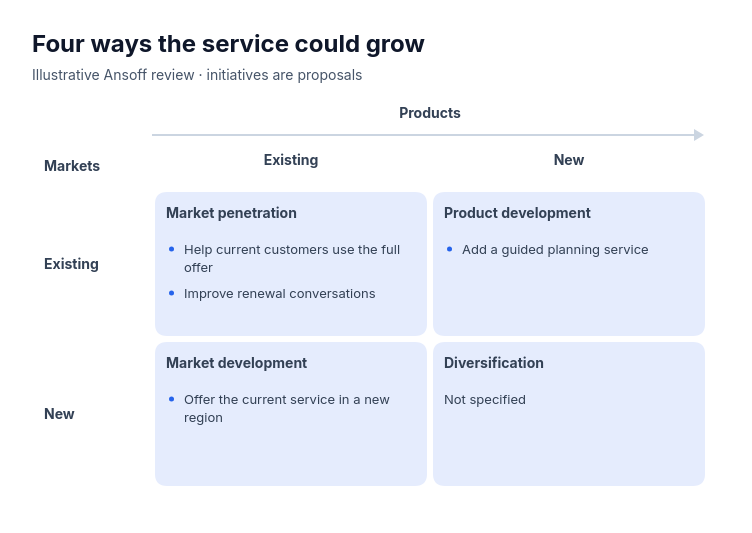 Ansoff matrixFor a product, service or retail offer’s proposed growth choices using explicitly classified initiatives.
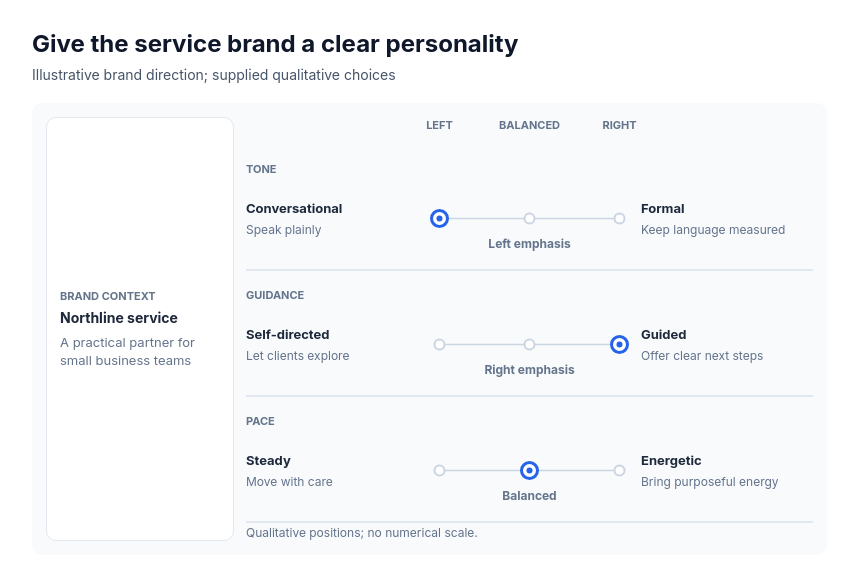 Framework: context panelFor two to four supplied trait pairs with explicitly chosen qualitative positions for one subject: a brand personality, a team's working style, a product's design principles, a leadership stance or a service's character.
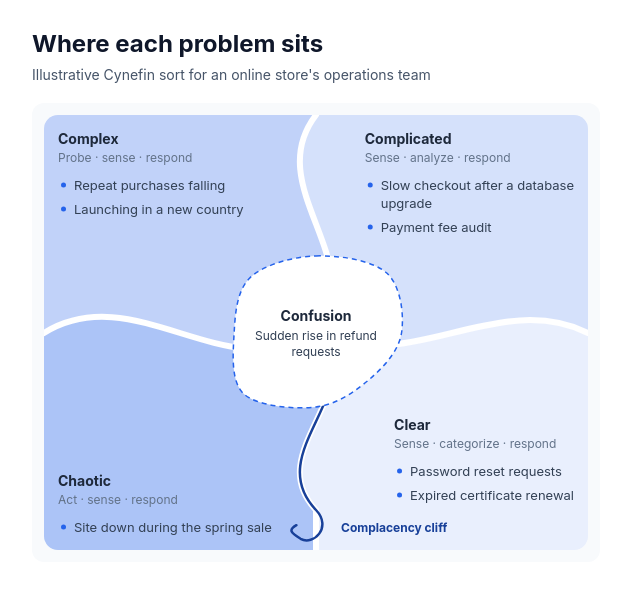 CynefinFor sorting supplied situations, incidents, decisions or kinds of work by how cause and effect relate, so a team agrees how to respond: incident triage, strategy choices, portfolio or project work types, leadership coaching.
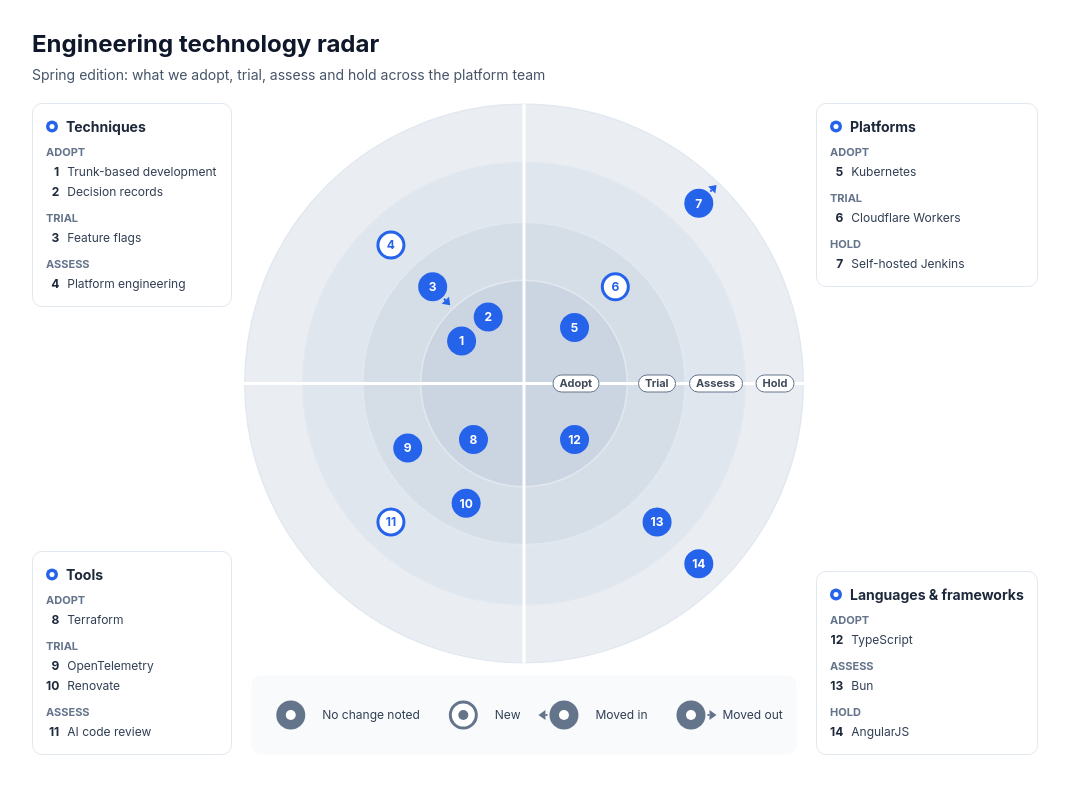 Radar: four quadrantsFor sorting six to twenty named items into four categories and three or four ordered commitment levels: technology radars (adopt, trial, assess, hold), vendor and tool shortlists, initiative portfolios by readiness, market or channel bets by commitment, and practices by maturity.