Diagram template
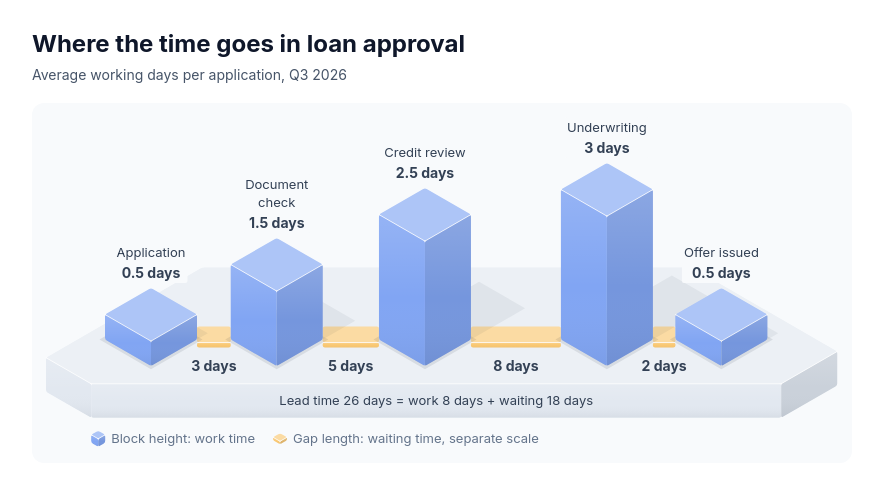
Process: isometric corner-on row of stage blocks on a plinth
MaxThree to six equal-footprint stage blocks stand corner-on in process order in one row on a shared plinth; each block's height is exactly its stage's work time on one scale, and the floor gap between neighbouring blocks, spanned corner to corner by a low lying slab of exactly that length, is exactly the waiting time before the later stage on a second scale. Each stage's name and work time stand upright above its block, each wait's value stands on the floor in front of its slab, the plinth's front face states the derived lead time as work plus waiting, and a key under the plinth names both encodings.
Categories
Included in
Max
When to use it
For showing how much of a process's lead time is work and how much is waiting, in three to six ordered stages with a supplied work time per stage and a supplied wait between consecutive stages, all in one time unit: order fulfilment, hiring pipelines, loan or claim approval, feature delivery, support tickets, procurement. Heights and gaps use separate scales, so compare heights with heights and gaps with gaps; the totals carry the work against waiting comparison. Not for branching or parallel flows, stages without known durations, costs or other non-time quantities, more than six stages or long stage names.
Adjust after generating
Change the style, colors, and font, and these options, as often as you like without spending credits.
- Typography
- Spacing
What you fill in
Describe your topic in plain words and the AI fills these in. You can edit every field afterwards.
- Stages
- 3 to 6, each with label, duration, and optional wait
- Suffix
- Text
Related templates
All process templates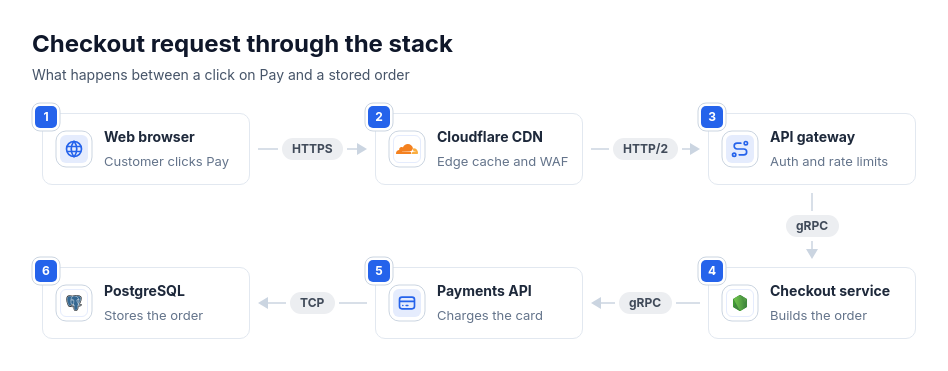 Architecture: request pathThree to eight hops of one request in order, such as a request through CDN, gateway, services, and database, an auth or checkout request trace, or a webhook delivery path, optionally with the protocol or measured time of each link.
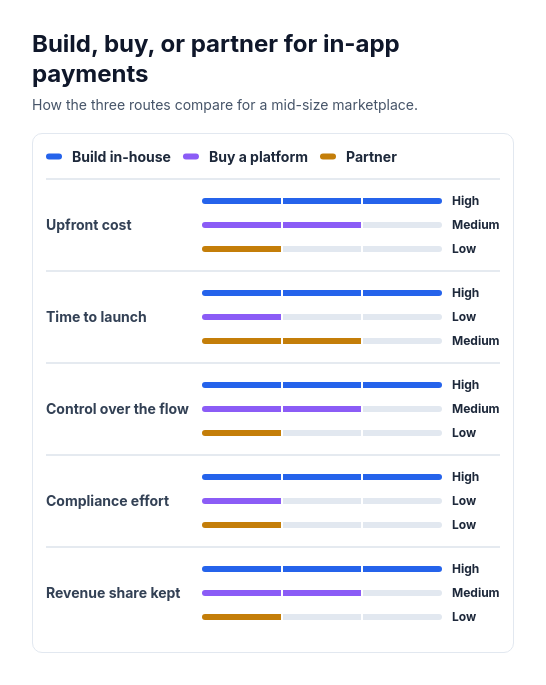 Attribute barsCompare two or three options across three to six attributes that can be scored or rated low, medium, or high, such as cost, speed, and effort.
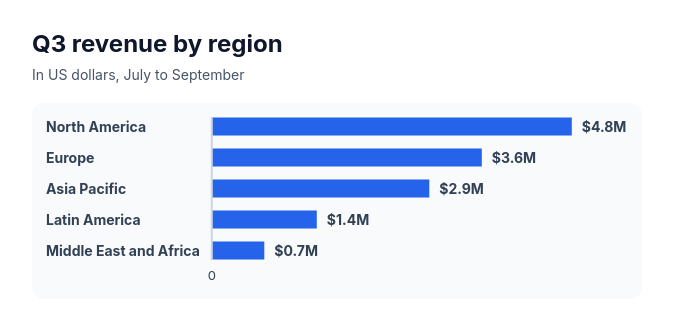 Bar chartCompare three to ten amounts of the same kind, such as sales by region, survey answers, or time per task.
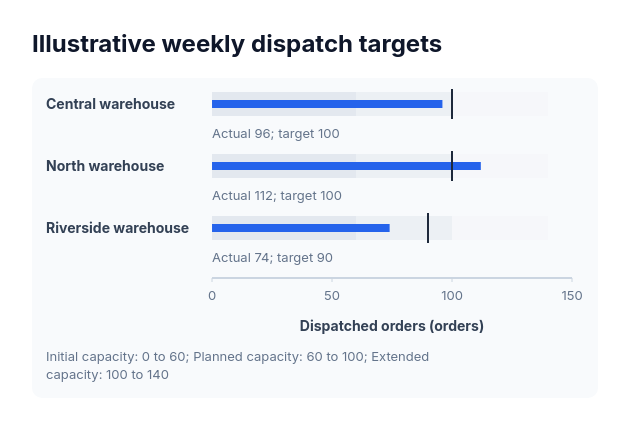 BulletActual-versus-target values sharing one nonnegative scale and explicitly supplied range boundaries.
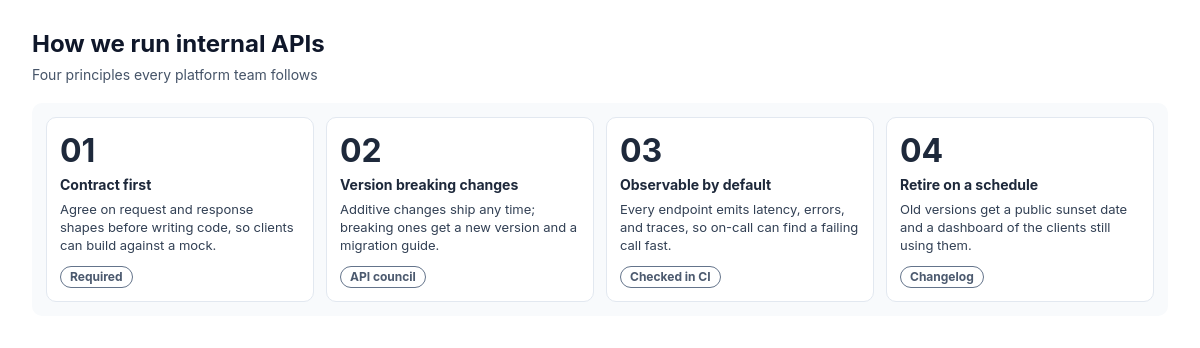 Numbered takeaways with optional footnotesParallel principles or takeaways.
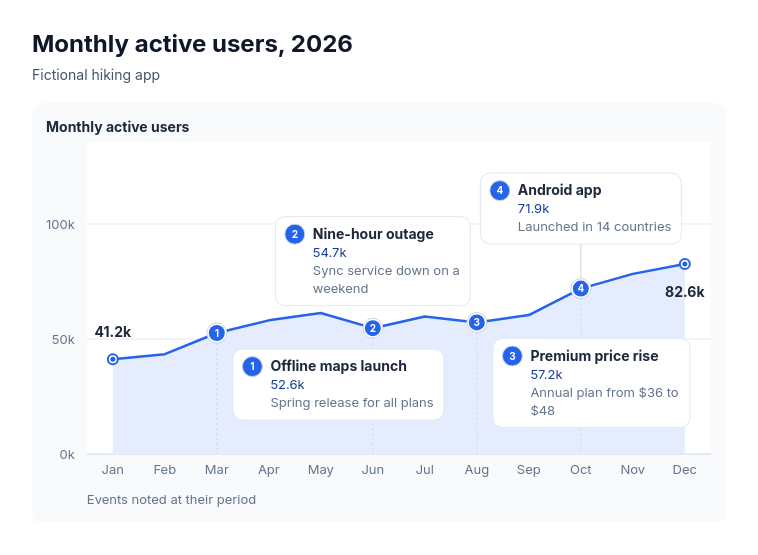 Annotated lineSuits explaining the turns in one measure over time: monthly active users with launches and outages, revenue with pricing changes, support volume with policy changes, website traffic with campaigns, headcount with reorganisations.