Diagram template
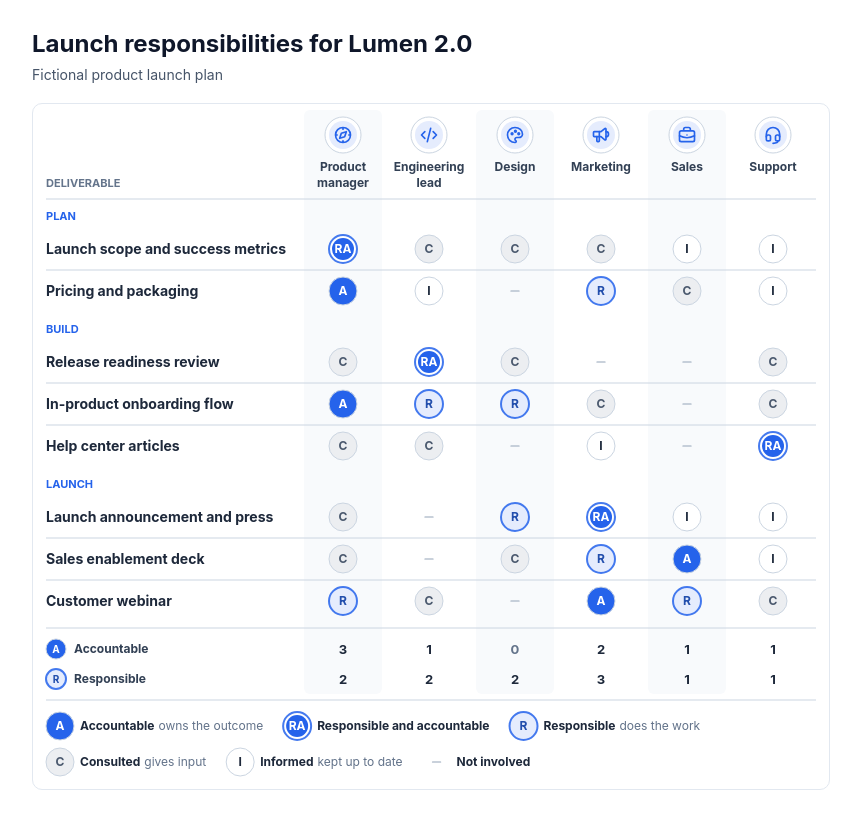
RACI matrix
PowerA responsibility matrix of two to twelve tasks, optionally in consecutive groups, against three to eight role columns headed by icons or initials. Each cell carries one code mark: solid accountable, solid inside an accent ring for responsible and accountable, tinted responsible, neutral consulted, an outlined letter for informed and a dash for not involved. Per-role accountable and responsible totals and a letter key close the card.
Categories
Included in
Power, Max
When to use it
Use to show who does, owns, advises on and hears about each piece of work: product or campaign launches, process ownership, governance and approvals, onboarding plans, procurement or incident response. Every task has exactly one accountable role. Not for task schedules or dependencies, reporting lines, or rating options against criteria.
Adjust after generating
Change the style, colors, and font, and these options, as often as you like without spending credits.
- Card shape
- Card border
- Card shadow
- Typography
- Spacing
- Icon shell
- Material
- Avatar shape
What you fill in
Describe your topic in plain words and the AI fills these in. You can edit every field afterwards.
- Item label
- Text
- Roles
- 3 to 8, each with name and optional icon
- Tasks
- 2 to 12, each with title, optional group, and assignments
Related templates
All table templates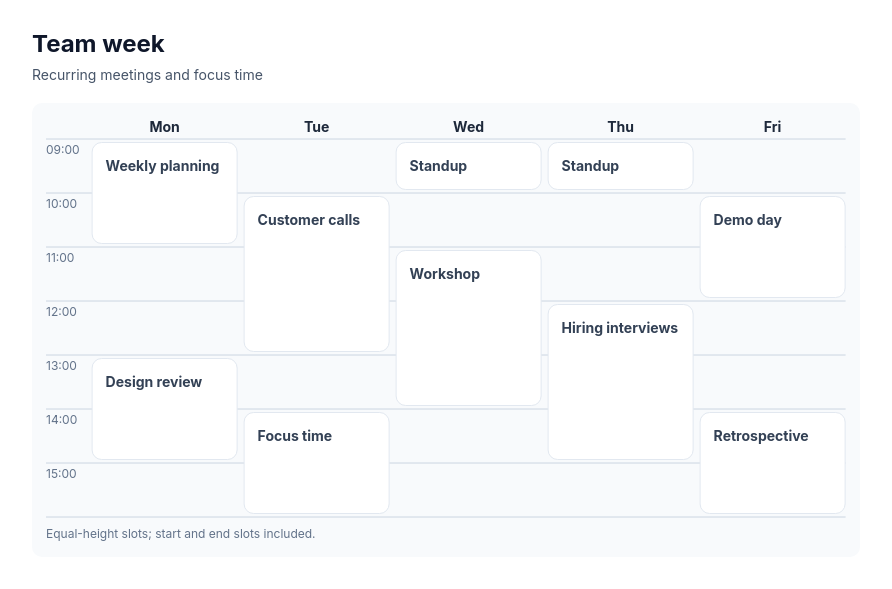 Calendar gridA schedule laid out by period and time slot, such as a week timetable, a conference day plan, a content calendar by week, or a weekly meal or workout plan, with events that occupy one or more consecutive slots.
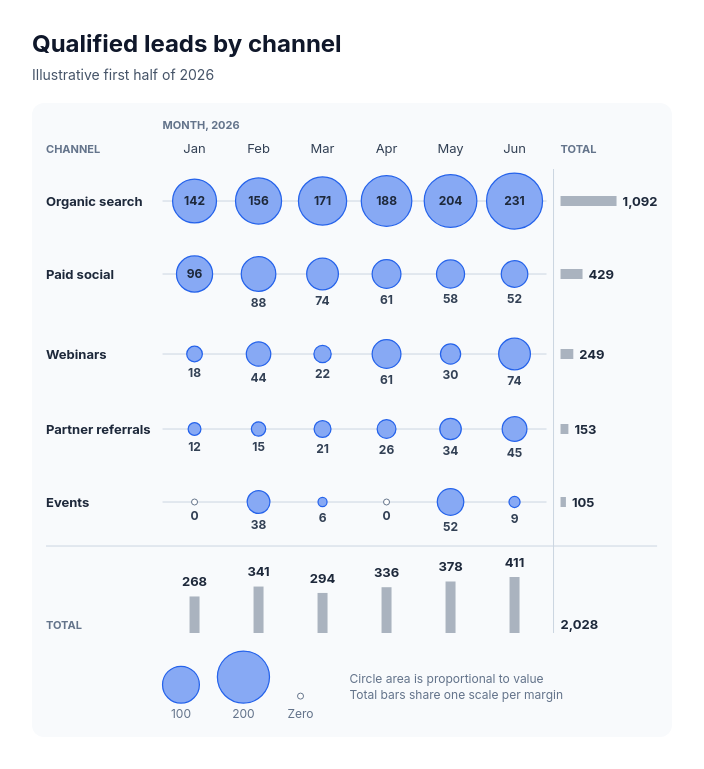 Chart: bubble gridShow how one additive measure spreads across two lists when the pattern of large and small amounts matters more than exact shades, such as leads by channel and month, feature usage by customer segment, skills by team, or orders by store and weekday.
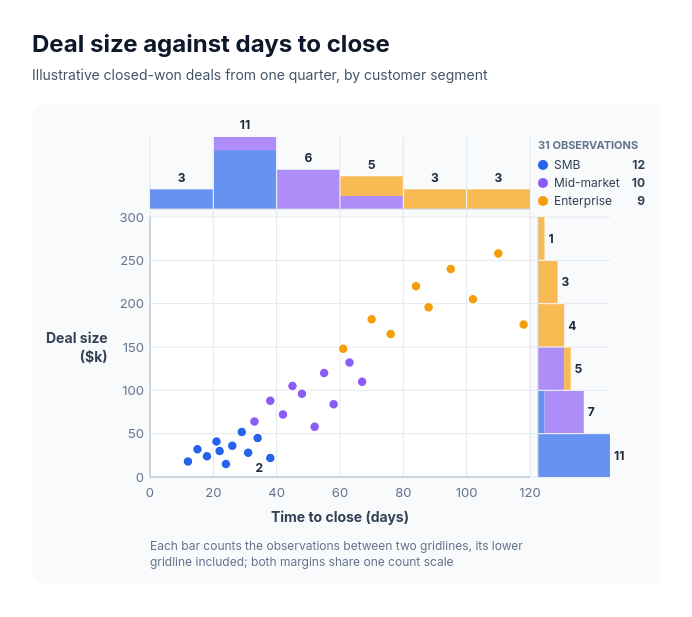 Chart: scatter plotShow how two measures relate across many observations and how each one is distributed, such as deal size against days to close by segment, delivery time against distance by region, customer tenure against monthly spend by plan, or response time against satisfaction score by channel.
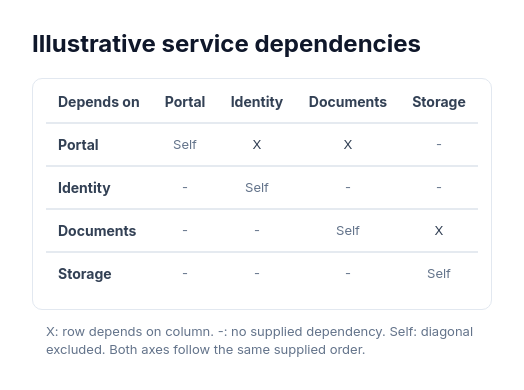 Dependency matrixDense binary dependencies including cycles and reciprocal edges.
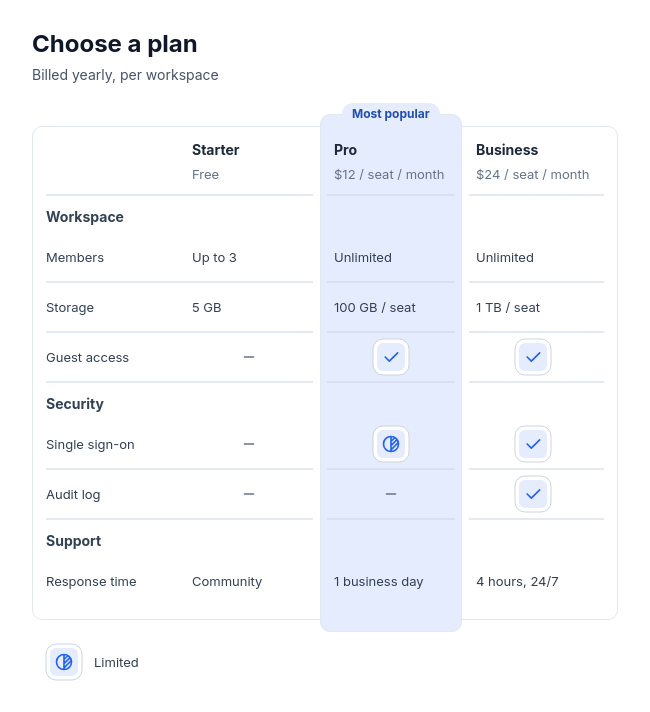 Feature tableCompare two to four plans, products, or tools feature by feature, with three to twelve rows in up to four labelled groups, and optionally one recommended option.
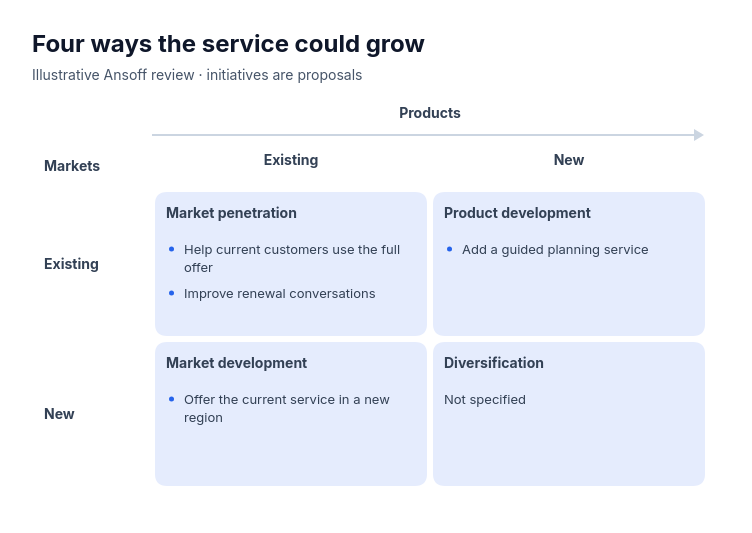 Ansoff matrixFor a product, service or retail offer’s proposed growth choices using explicitly classified initiatives.