Diagram template
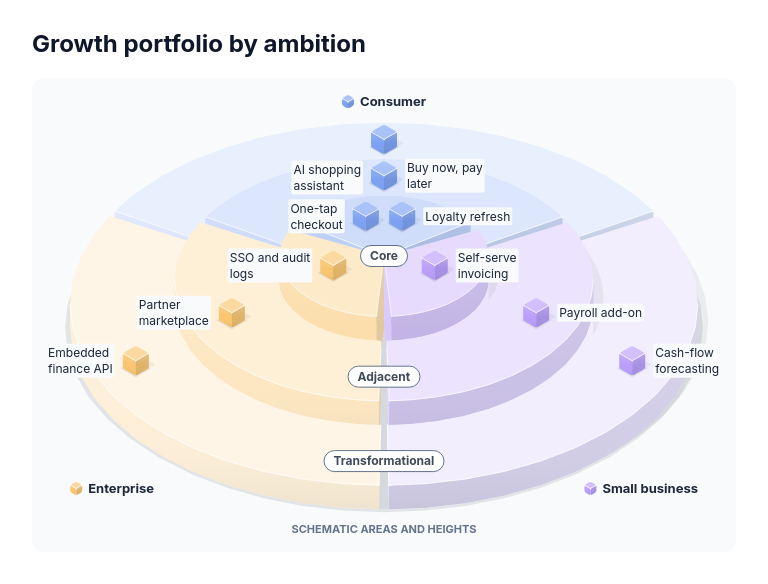
Matrix: isometric concentric terraces rising to the center
MaxTwo or three concentric ring terraces, the innermost a disc standing highest, all split into the same two to four seamed sector wedges in one color per sector, named outside the terraces beside a key cube; three to twelve equal cube blocks stand on the terrace top of their ring and sector in supplied order clockwise, each labeled upright beside it, with the ring names as pills from the disc's center down the front axis and a note that areas and heights are schematic.
Categories
Included in
Max
When to use it
Use when entries are sorted by two categories, one of them a ring order from closest or core outward: an innovation ambition matrix (core, adjacent, transformational by business line), a technology radar by adoption ring and quadrant, stakeholders by proximity and group, partner ecosystem tiers by category, now, next and later by team. Ring widths, heights and sector sizes are schematic and carry no amount; position inside a cell carries no rank. Not for numeric scores or amounts, more than three rings, more than four sectors, more than three entries in one ring and sector or more than twelve in all.
Adjust after generating
Change the style, colors, and font, and these options, as often as you like without spending credits.
- Typography
- Spacing
What you fill in
Describe your topic in plain words and the AI fills these in. You can edit every field afterwards.
- Rings
- 2 to 3
- Groups
- 2 to 4
- Entries
- 3 to 12, each with label, group, and ring
Related templates
All matrix templates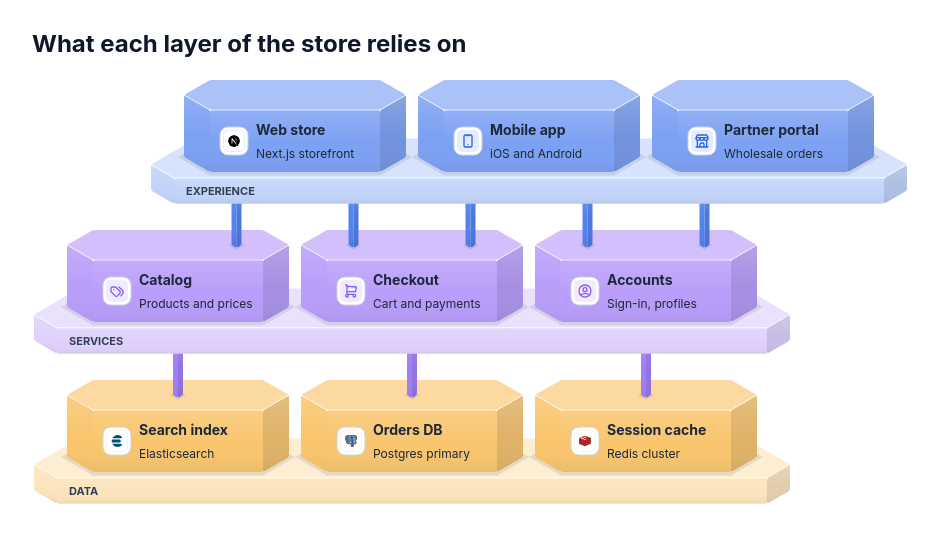 Architecture: isometric floating layer plates stacked with a clear gapA layered system where components rely on specific components in the layer directly below: software layers from experience through services to data, an operating model from strategy through operations to delivery teams, or a data stack from reports through warehouse and pipelines to sources.
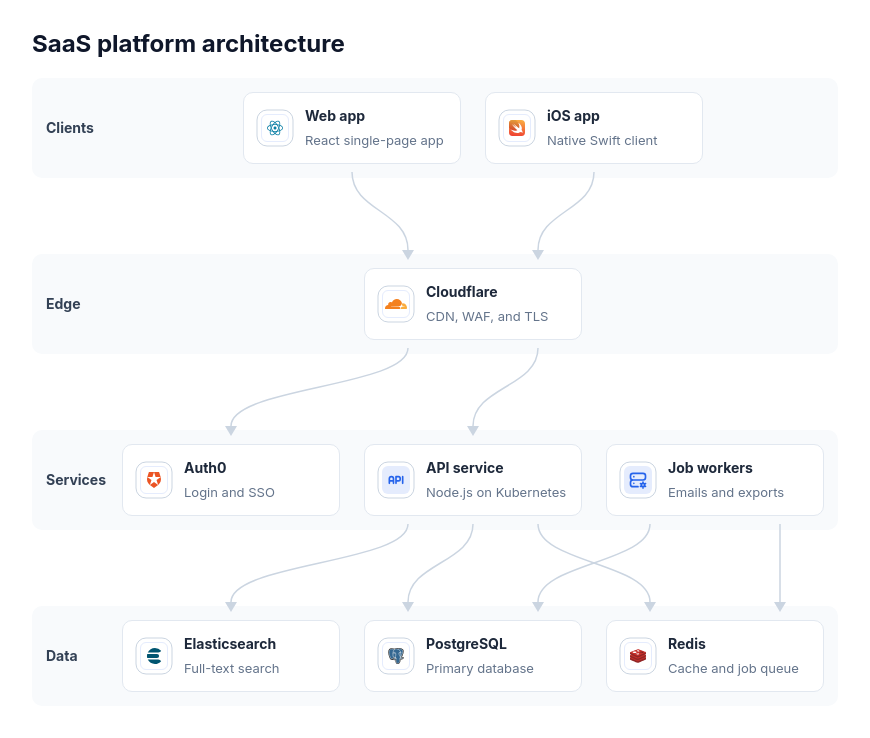 Architecture: stacked layer bandsA system of two to sixteen components arranged in two to five layers, such as a web app's stack or a SaaS platform from clients through edge and services to data, with calls between neighboring layers.
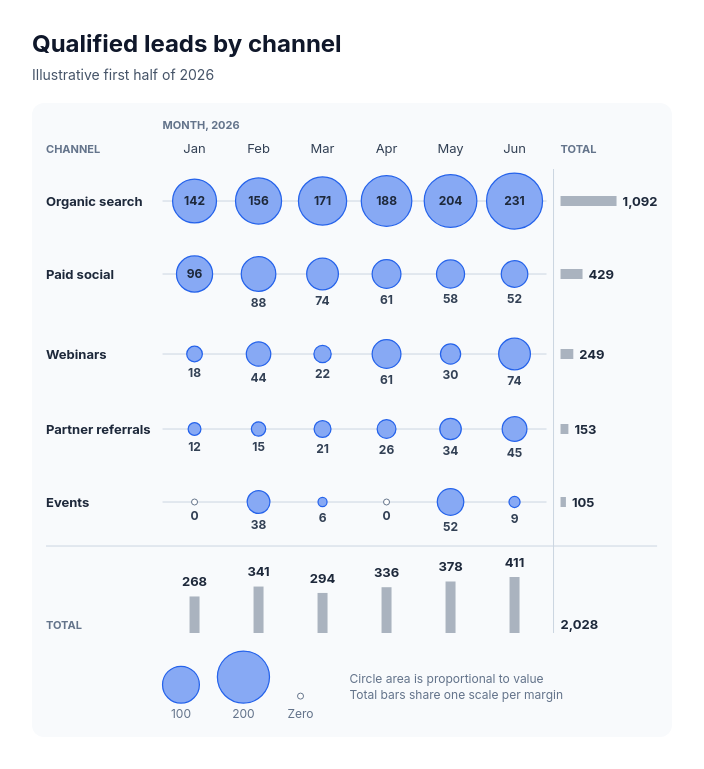 Chart: bubble gridShow how one additive measure spreads across two lists when the pattern of large and small amounts matters more than exact shades, such as leads by channel and month, feature usage by customer segment, skills by team, or orders by store and weekday.
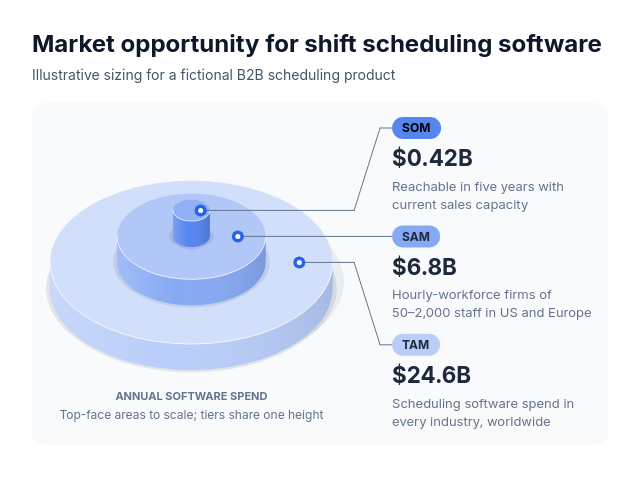 Market sizing: isometric stacked cylinder tiersSuits nested sizes of one quantity where each level is a subset of the one below it, when a solid presentation look suits the slide: total, serviceable and obtainable market (TAM, SAM, SOM), addressable users narrowing to reachable and converted users, a sales universe narrowing to qualified pipeline, or a total budget narrowing to allocated and spent.
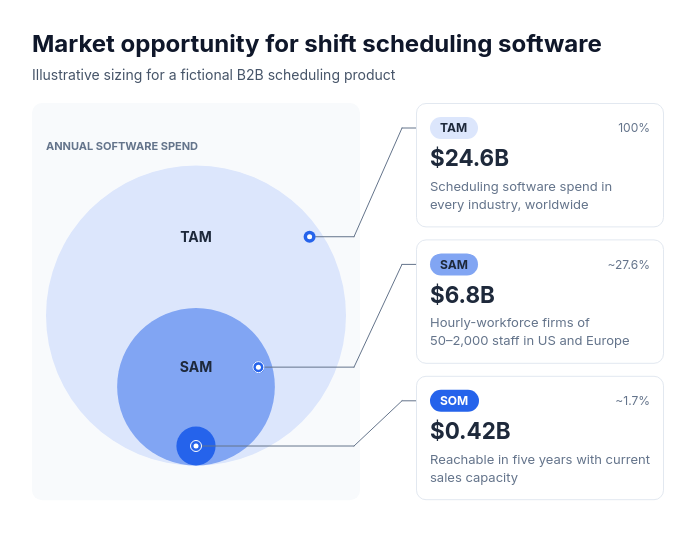 Market sizing: nested bottom-aligned circles by areaSuits nested sizes of one quantity where each level is a subset of the one before: total, serviceable and obtainable market (TAM, SAM, SOM), addressable users narrowing to a target segment, a sales universe narrowing to qualified pipeline, or a budget envelope narrowing to committed spend.
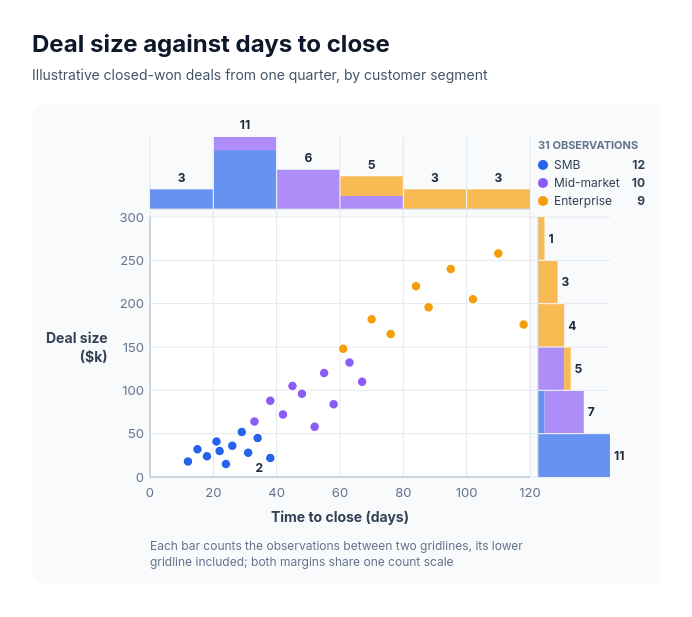 Chart: scatter plotShow how two measures relate across many observations and how each one is distributed, such as deal size against days to close by segment, delivery time against distance by region, customer tenure against monthly spend by plan, or response time against satisfaction score by channel.