Diagram template
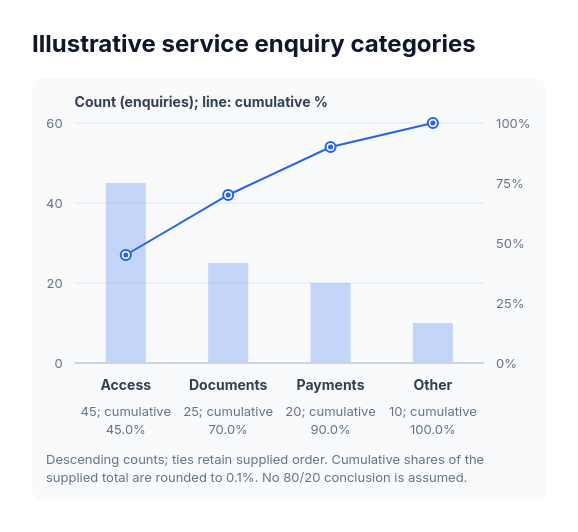
Pareto
PowerDescending exact-count columns with a separate cumulative-percent line and complete category details.
Categories
Included in
Power, Max
When to use it
Use to rank a supplied complete set of category counts and inspect their cumulative share. Sorting is intrinsic and ties preserve source order. Unlike ordinary category bars, this derives a cumulative whole; it does not assert an 80/20 law.
Adjust after generating
Change the style, colors, and font, and these options, as often as you like without spending credits.
- Card shape
- Typography
- Spacing
What you fill in
Describe your topic in plain words and the AI fills these in. You can edit every field afterwards.
- Unit
- Text
- Bars
- 2 to 8, each with label and count
Related templates
All chart templates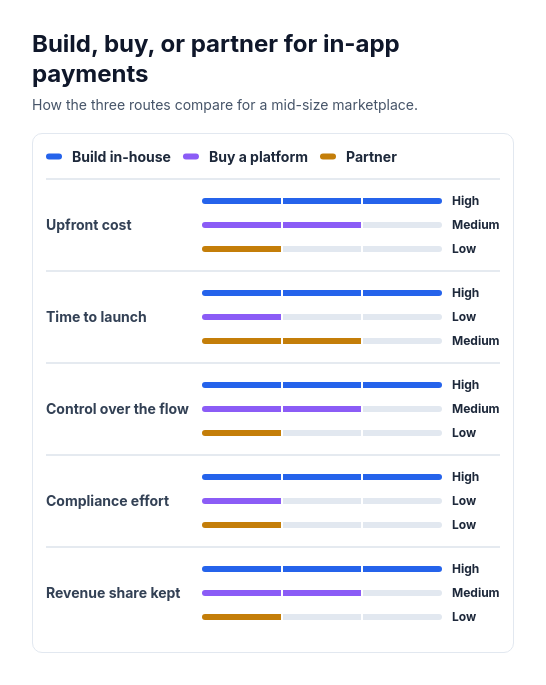 Attribute barsCompare two or three options across three to six attributes that can be scored or rated low, medium, or high, such as cost, speed, and effort.
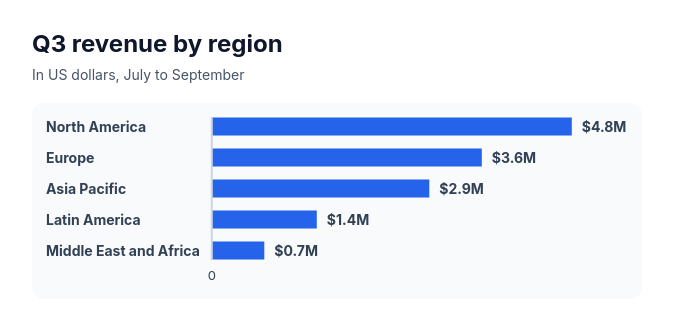 Bar chartCompare three to ten amounts of the same kind, such as sales by region, survey answers, or time per task.
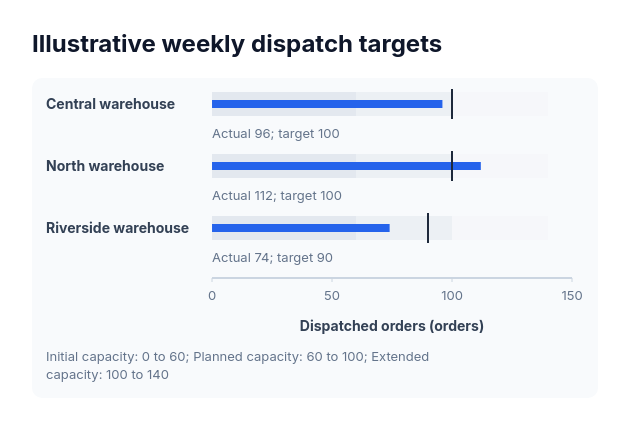 BulletActual-versus-target values sharing one nonnegative scale and explicitly supplied range boundaries.
 Annotated lineSuits explaining the turns in one measure over time: monthly active users with launches and outages, revenue with pricing changes, support volume with policy changes, website traffic with campaigns, headcount with reorganisations.
 Chart: arc diagramShow how much pairs of participants share, and who is most connected, when order along a line helps: joint projects between teams, referrals between channels, cross-sell between products, trade between regions, co-authorship between groups.
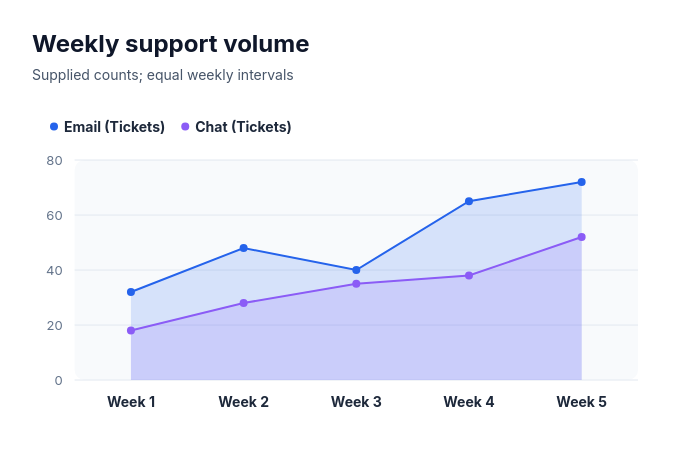 Area chartCompare 1–4 complete nonnegative series over 3–10 supplied equally spaced ordered categories as overlapping filled areas from zero, with point and line boundaries.